Tag: planning

LADWP’s Paper Water Leverages on MWD Supplies

Published / by dcoffin / Leave a Comment

When the LADWP uses paper water, not only does it affect Los Angeles residents, it also impacts utilities and residents outside of the city. 'Paper water' is water that “utilities claim they have access to, but is difficult or impossible to access for various reasons”.

When the LADWP claims to have access to more city owned domestic water than it really has access to, that allows the department to understate how much water it needs from the Metropolitan Water District.   

MWD Makes up for LADWP Paper Water

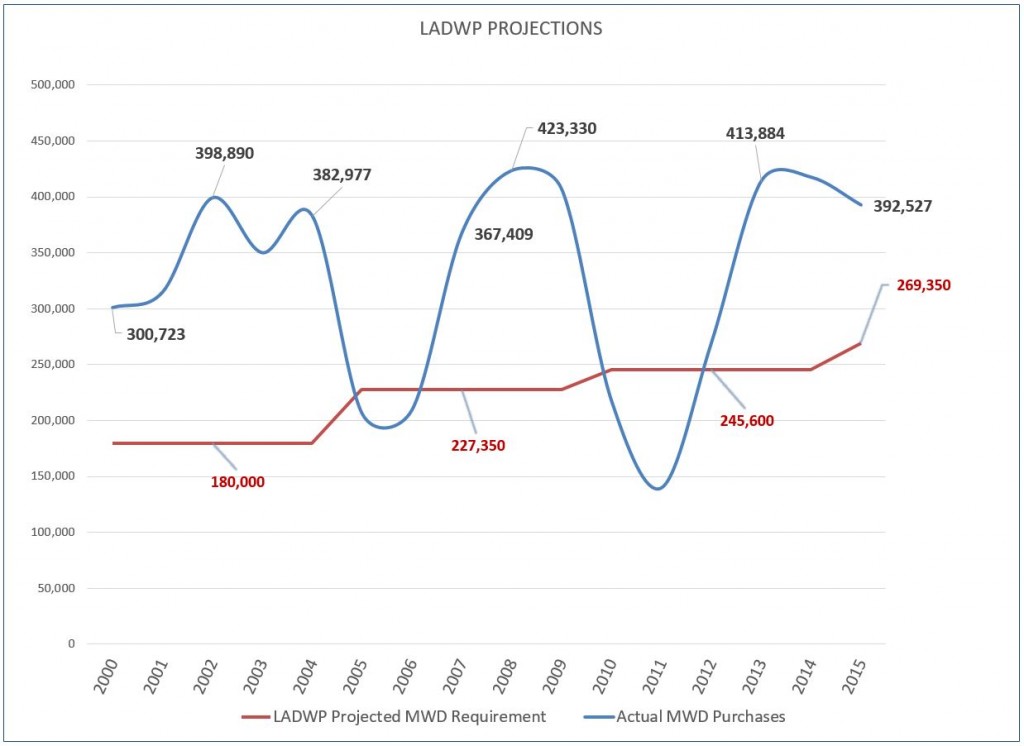
Using paper water to prop up the perception of its domestic supply, the 2000 UWMP* suggested that the LADWP would only need to purchase and additional 3.53 million acre-feet of water between 2000 and 2015.

However the department was unable to follow through on its claims. Only 4 times in 16 years did the department meet its own projections. Over the other years it had to purchase 47% more water from the MWD amounting to 5.20 million acre-feet at a greater unit cost. 

This is one of the ways that the department hides the water shortage in the EIR's that work their way through the planning process to shield development.

Obviously this practice would impact the MWD's operations to store surplus water as a hedge against drought in its Diamond Valley Reservoir and at Lake Mead.

*I used the 2000 UWMP because it presented a larger sample size of MWD purchases than later plans would. Later UWMP's use paper water similarly.  

The WSA – Bringing Imaginary Water to L.A.’s Big Projects

Published / by dcoffin / Leave a Comment

In a previous article I wrote that The Los Angeles Department of Water and Power was confronted with two conflicting demands that dates back to 1990. The department’s conflict is between providing enough water to city residents from a rapidly shrinking water supply that once averaged 680,000 Af/y and is now just over 610,000 Af/y and then also show evidence that the city’s water supply is growing to assure continued growth. 

By now most of the public is well aware that there is a water shortage and that the DWP has been furiously trying to reduce the city’s residential per capita consumption by bombarding the media with accounts of shortages, imposing emergency drought restrictions, ‘drought shaming’ residents into using as little water as possible, and even paying them to tear out lawns and substitute it with drought resistant landscaping.

What the public is not aware of is that the LADWP puts on a very different face when it comes to assessing demand and assuring water supply for large new projects that consume the equivalent of 500 units or more in its Water Supply Assessments also known as WSA’s. Performing a water supply assessment is required by state law for very large projects and the department has produced more than seventy of them since 2005.

You need water? We got the water! Step Right in line.

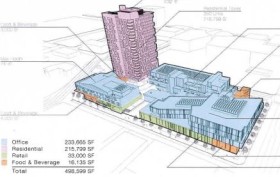
1444 unit SOLA Village ProjectThe DWP’s water assessments are akin to a Hollywood movie set whose front facing facades of old western towns look like the real thing but when you step through a door all you find is an empty lot.

Read through a WSA and you’ll be transported into a parallel world where there’s plenty of surplus water to support a projects demand for the next twenty years along with all the other planned future demand that don’t trigger water supply assessments. But look behind the report at the actual supply figures and you’ll find that like the old western town on the big screen, the WSA is a mere facade as well.

Let’s take a recent example of the large 1,444 unit downtown SOLA Village project that the LADWP recently recommended to the Board or Water and Power for approval. Keeping in mind that the City of Los Angeles is already reeling from a water shortage and has been since 1990, the DWP’s Water Resources Section concluded in the projects water supply assessment that “adequate water supplies will be available to meet the total additional water demand” and that the demand “can be met during normal, single-dry, and multi-dry water years” for the next 20 years!

The department came to this conclusion by citing water demand and supply forecasts from its own current Urban Water Management Plan. A practice that is allowed by the state but should bring to question the sincerity to the laws “Show Me the Water” hype.

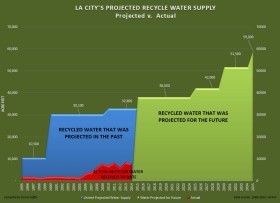
unmetRCYThe city’s past water plans have always claimed to have access to amazing amounts of water but in reality its water that can never be delivered or touched. You’ll never be able to wash your hands with it or sip it from a glass. Its imaginary water destined only for the pages of WSA's and UWMP's that are used to approve projects by decision makers.

For instance, supporting the SOLA Village project, the WSA cites that over the next twenty years the department will be able to build up recycled water supplies “eight-fold” to an amazing 59,000 Af/y by 2035. The problem however is that they’ve made similar claims to this in every preceding water plan going back to 1990!

The 2010 and 2005 plans that are routinely cited in the city's WSA’s both stated that we would be enjoying 20,000 Af/y of recycled water by 2015! In reality though, we’ve only seen an average of 7,392 Af/y since 2005 and we missed the 2015 target by 13,000 AF or 4.2 billion gallons.

Touching on another source of water, the SOLA Village WSA goes on to claim that stormwater capture will increase the water supply by 25,000 AF. Stormwater capture while not new, has been getting a lot of press attention lately when it was singled out by the city as a promising groundwater recharge component that would increase supplies.

But stormwater capture along with groundwater is highly speculative and certainly not sustainable on a year-to-year basis given the whims of Mother Nature. We can only look at averages and the averages have never been good to WSA’s when you look at them historically.

Certainly the city could bump up groundwater recharge with larger catch basins but rain barrels? Seriously? The departments WSA suggests that 10,000 Af of the 25,000 AF total would be met by rain barrels and cisterns. It would take 65 million of those plastic 50 gallon barrels that cost residents about $100 to buy. I suspect that the DWP is perhaps leaning towards underground cisterns to capture some of that water. But how would we know? WSA doesn’t positively identify how many or where these cisterns will be located. It just throws out the claim. WSA’s are supposed to “Show Me the Water” as the law was named, not make empty promises.

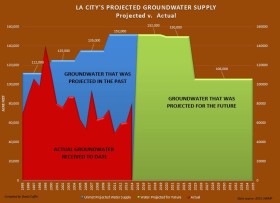
unmetGWContinuing on empty promises, groundwater has always been the department’s go-to resource when you need to bump up imaginary water. The SOLA Village WSA benefits in this trend by citing wild groundwater claims that states the department will be able to deliver more than 100,000 AF year-after-year. However, so did literally every plan before it.

Since 1990 the DWP’s Water Systems Section has repeatedly claimed the city would be receiving an average of 100,000 AF or more each year but that was never met. The WSA doesn’t tell you that. The city’s average yield has been just 67,000 Af since 2000. The WSA also doesn’t tell you that. It doesn’t tell you that only three times since 1990 has it ever exceeded 100,000 AF. It doesn’t really tell you we really don’t have enough water for these projects.

Susceptible to Challenge                                                              

Given the way the department carelessly cites access to large sums of unobtainable water to shore up evidence of sufficient supply, this makes WSA susceptible to challenge. WSA’s are a requirement of SB 610 and SB 221 which are collectively known as the “Show Me the Water Laws” but  LADWP’s WSA’s plans have not done that since 1990.

California’s Challenge to Reliable Water isn’t Infrastructure. It’s RHNA

Published / by dcoffin / 6 Comments on California’s Challenge to Reliable Water isn’t Infrastructure. It’s RHNA

The state’s biggest challenge in meeting the population’s water supply requirements isn’t conservation, it isn’t lack of infrastructure, not storage, and not groundwater. It’s RHNA, a little known wonkish piece of legislation embodied in Government Code 65580 that's mostly known to planners, developers and city hall staffers. 

What follows might sound like we’re veering away from the focus of this blog but stick with it, RHNA affects water demand (and electric power and traffic) in a very heavy handed, mindless way. You’ll see why.

State Level RHNA

RHNA (Regional Housing Needs Assessment) is a law that requires the state Department of Housing and Community Development (HCD) to establish the region’s existing and projected housing needs. RHNA prods and some might say it threatens cities into produce housing and while it presses for growth, nowhere in the state level is there an evaluation as to whether the water supply is available.

The RHNA process starts out with population projections generated by the state’s Department of Finance (DOF). These population figures are then sent to HCD which takes this data and develops regional housing (RHNA) allocations. The allocations, spread out evenly between Northern and Southern California, are distributed among 38 regional planning agencies through a RHNA Determination Letter.

Regional Level RHNA

Every region in the state has a planning agency that assigns housing allocations to the cities and communities they oversee. When regional planning agencies receive the Determination Letter, they take the regional RHNA allocations in it and break it down to city level RHNA allocations. When the HCD sent Southern California its Determination Letter showing RHNA allocations (pdf), the Southern California Association of Governments (SCAG) w­­­as assigned to provide between 409,060 and 438,030 housing units to be spread out among its 191 cities inside Los Angeles, Orange, Riverside, San Bernardino, Imperial and Ventura counties. The planning agency that represents San Diego (SANDAG) was assigned to provide 161,980 units.

To name a few other regions, if you live in Fresno its planning agency (FCOG) was assigned a RHNA allocation of 41,470 housing units. Kern’s planning agency (KCOG) was assigned a RHNA allocation of 67,675 housing units and the San Francisco Bay Area agency (ABAG) was allocated to provide for 187,990 new units. Regional planning agencies simply accept the HCD numbers at face value.

This step in the RHNA process tends to get a little ugly. Using a number of factors such as jobs, density, transportation, income levels, developable land, the regional planning agencies divide up their regional allocations into city level RHNA allocations (pdf). The regional planning agencies do not evaluate whether there is a sufficient water supply available to support housing requirements when they impose the allocations on the cities or communities. This is where the disconnect, intentional or not begins.

Some cities like Los Angeles accept these housing allocations with reckless abandon and run with it while other cities like Irvine, Palmdale, La Mirada and Pleasanton have tried unsuccessfully to challenge the regional agencies role and RHNA allocations in courts. In Irvine, the city had designated a decommissioned naval base to be the site of the “Orange County Great Park’. However, SCAG saw its potential as a huge housing development and applied a RHNA allocation of 35,660 units to the city. Pleasanton sought to limit growth with caps that were approved by voters but was sued because their housing plan they did not comply with RHNA.

City Level RHNA

The next and final step in the RHNA process is at the city level. Each city after having received their share of RHNA allocations must now incorporate it into a housing plan called the ‘Housing Element’. The Housing Element identifies the locations of all the parcels in the city that are candidates for higher density growth and is one of the eleven 'elements' that goes into a city's 'General Plan'. This is effectively the only place throughout the RHNA process where water supply comes into play, albeit indirectly.

The Housing Element does not evaluate whether there is a sufficient water supply available to support housing requirements. Instead it leaves it up to the water agencies UWMP. In the City of Los Angeles’s Housing Element, it has a section on ‘infrastructure’ where water supply is brought up. Here, the plan cites the 2010 UWMP stating “there is an adequate supply of water to serve the population growth projected through the year 2030, beyond the Housing Element planning period.

Clearly the adequacy of the water supply in Los Angeles is demonstrably untrue, but there is no regulatory oversight anywhere in the RHNA process that will halt a project when there is no water to support it. If the water plan is based on faulty assumptions, the project will glide through to approval making it nearly impossible to create a reliable water supply.

Challenging RHNA is not possible. Courts say they have no jurisdiction. Challenging the water is one of the few areas where housing allocations can be reduced but it’s not part of the regulatory process. In “Show Me the Water Plan (E. Hanak/PPIC)”, the paper states that “planning laws (SB 221 & SB 610) rely largely on citizen enforcement rather than regulatory oversight by the state” and “that citizens can challenge the responsible local agencies in civil suits.”

Challenging water supply has been done from time to time by highly motivated groups of citizens. In “California Water Planning 2009 Vol 4 Reference Guide”(R. Waterman) this study described one such instance when a Santa Clarita group called “Santa Clarita Organization for Planning the Environment” challenged an EIR for a project involving 2,545 homes, a retail center and 42 acres of community facilities. In (SCOPE) v. county of Los Angeles, The judge agreed and the court rejected the EIR stating that the “county’s approval of the West Creek EIR is not supported by substantial evidence (of available water).”

But while its happened from time to time it’s not a process that citizens are familiar with and having citizens challenge thousands of projects a year one by one to enforce SB 221 and SB 610 (the “Show me the Water Laws”) is an undue burden. Furthering the burden, the State has legislation such as SB 1818 that allows cities and developers to squeeze more units into a parcel even when its zoned for lower densities.

Cities are not likely to challenge a developers rights to construct housing if the allocations have not been met. RHNA’s complicated process give developers the legal foundation to build new housing and sue if cities don’t cooperate, even when it is obvious to everyone that there is no water available for the project.

So where’s RHNA going to take us?
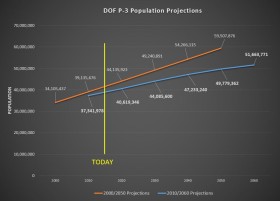
RHNA is driving up water demand. The Housing Element is updated every eight years and new RHNA allocations come out for each new refresh so what we see every eight years are just small chunks of the housing allocations which keeps the long term past and future view pretty well hidden.

Because RHNA takes its cue from DOF population projections which extend 50 years, if you want to know where RHNA is taking us look no further than the DOF P-3 projections.

These fifty year projections can swing up and down quite a bit. The 2050 projections were reduced 10 million people between the 2006/2014 and 2013/2021 but the damage is already done despite the reduced projection.

L.A.'s last RHNA allocation was 112,876 and it led to a large number of permits being approved though not all of them were necessarily built given the economic crash that occurred in 2008. However, once entitled, they stay entitled. When the economy picks up, the construction can begin. The latest RHNA allocation for Los Angeles dropped to 82,000.

The current DOF projections show the state growing to a population of 51,663,771. With this we can expect the RHNA to increase the density to increase 16% by 2030 and by 32% by 2060. A 32% increase in the City of Los Angeles suggest that water demand would increase over 938,000 Af/y if the city’s demand was held at the current 142 gallons per capita daily. That’s is about 356,000 acre-feet a year over the city’s actual average supply.

But realistically, if the RHNA process continues unrestrained by water supply, the city would have to reduce the demand to 88 gallons per capita daily to meet 2060 population targets. This is not “residential gpcd”, this is the entire city’s demand including commercial, industrial, government and residential! And what's worse.. this is just the City of LA. Imagine how disastrous and frequent droughts will be when the state hits its 16% growth target by 2030 and 32% target by 2060.

California can never have a reliable water supply unless serious reforms are made to RHNA.

(updated on 6/14/2015)
LA City Water Assessments Edge into the Absurd

Published / by dcoffin / Leave a Comment

Water supply assessments for two large projects have been approved by the LADWP water resource planners and is coming to the City of Los Angeles Board of Water and Power Commissioners on June 2 for approval. 

The LADWP cites its own 2010 UWMP claiming there is sufficient water for these two projects through the year 2035, and enough for all other "existing and planned future demands".

academy squareThe two projects that apparently passed muster are the 250 unit Academy Square Project in Hollywood and the 1,444 unit South Los Angeles Village Project in downtown Los Angeles.
The 2010 UWMP they cite projected that the city would be receiving a yearly annual total supply of 614,800 Af/y by 2015. That would be made up with 252,000 Af/y of LA Aqueduct supply, 40,000 Af/y of ground water and 20,000 Af/y of recycled water.

Given the bad news the entire state has been dealt with over the last three years and the city is begging residents to rip out turf in an effort to conserve, it would be understandable if you thought that the city wasn't quite meeting its water supply targets. You would of course be right to think that.

The problem with the assessments for these projects is that since the approval of the 2010 water plan, the DWP's total water supply has averaged just 550,887 Af/y which 10% a year short of what it needs to meet the city's needs. When we look at the categories that make up the supply we find that the recycled water supply is short of its 20,000 Af/y by 84% at just 7,392 Af/y. Groundwater to date is ahead of the 2010 projection by 60% but is unlikely to meet 2020 through 2035 annual projections due to its cyclical nature. The 2010 UWMP plan also cites 40,000 Af/y of transfers for which there is no evidence of receiving and it counts 14,180 Af/y of 'conservation' as new water which it is not.

The 2010 UWMP is stuffed full of water that simply can't be accessed and is plainly 'paper water'.

How the Board of Water and Power Commissioners can approve these projects with a straight face given the severity of the drought is anyone's guess. The city appears to be in a 'state of denial' when it comes to the shortage as it approves these projects big and small. But it's also in a 'state of crisis' when it comes to prodding the public into conserving. It can't have it both ways.

Editors note: The DWP has not met any long term water projections outlined it its plans since 1990.

The Paper Water Years – LA’s 1995 – 2000 Water Plans

Published / by dcoffin / Leave a Comment

This is Part IV in a series describing L.A.’s water supply problems and the policies that produced it.

1995CoverIn Part III we saw how the city sought to maintain the 1985 baseline of ~175 gallons per capita daily in the 1990 UWMP while population estimates increased. As a result we saw the projected supply in the plan jump significantly from the previous plan. We also found that the DWP heavily leveraged the projected 1990 supply in the groundwater and recycled categories using water it had no chance of getting. These factors continued into the 1995-2000 UWMP's. 

The 1995 UWMP - L.A.'s 3rd Water Plan
The 1995 UWMP should best be known by the city’s acquiescence that water supply had its limits. Population estimates from the Southern California Association of Governments (SCAG) did not climb as dramatically as they had in the 1990 plan but the increase from 3.85 million to 4.25 million by 2015 (9%) was still the driving factor.

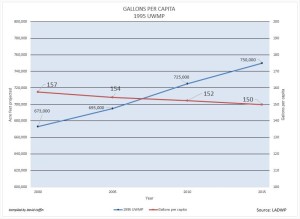
With future growth estimates continuing to drive the supply requirement of more water, DWP planners were forced to set a new precedent by reducing the per capita supply from 177 gallons per capita to 150 gallons acknowledging that less water would be coming through the Los Angeles Aqueduct due to recent court ordered restrictions of Mono Basin water and at current allocations, future growth would have demanded ridiculously large amounts of water that couldn’t be met.

1995GPC
Figure 1 - Big jump to reduce per capita supply

If the DWP planners tried to sustain the 177 gallons per day cited in the 1990 plan, the projected supply in the new plan would have shot up to 757,000 for 2000 and risen to 886,000 acre feet per year (Af/y) by 2015!

Historically though, reducing the per capita supply to 150 gallons per day per capita would not be enough. At this allocation the DWP suggested that it would have 695,000 Af/y by 2005 and could gradually increase that to 750,000 Af/y by 2015 (Figure 1). But in the years following the approval of the plan, the actual supply figures that came in would demonstrate the DWP's failure to achieve these projections suggesting that there was far too much paper water in the projections to be viable.

DWP planners accepted that less water was going to be available through the aqueduct system and reduced the aqueduct supply by 20,000 Af/y to 360,000 Af/y in the 1995 plan.

1995PW
Fig. 2 - 1995 Projections vr. Supply

To offset the loss of aqueduct water, DWP planners suggested that they could increase the already large projections of the 1990 plans and increase the availability of recycled water to 38,000 Af/y, and groundwater to 152,000 Af/y.

Through the years though, none of these figures would ever be achieved. Recycled water averaged a mere 2,300 Af/y and groundwater averaged just 87,000 Af/y proving the plan wasn’t working.

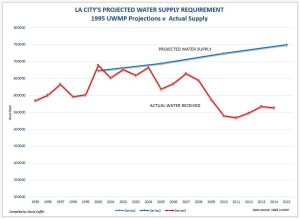
The historical significance of the 1995 plan was that the DWP would only muster up an average of 638,490 Af/y (Figure 2). Far less than the 750,000 Af/y that it promised. Because of the paper water fueled growing deficit, the DWP would start prodding the public into reducing its demand using such schemes as tiered pricing, washer rebate programs and require that all homes install low-flow toilets before resale.

The 2000 UWMP - L.A.'s 4th Water Plan

2000GPC
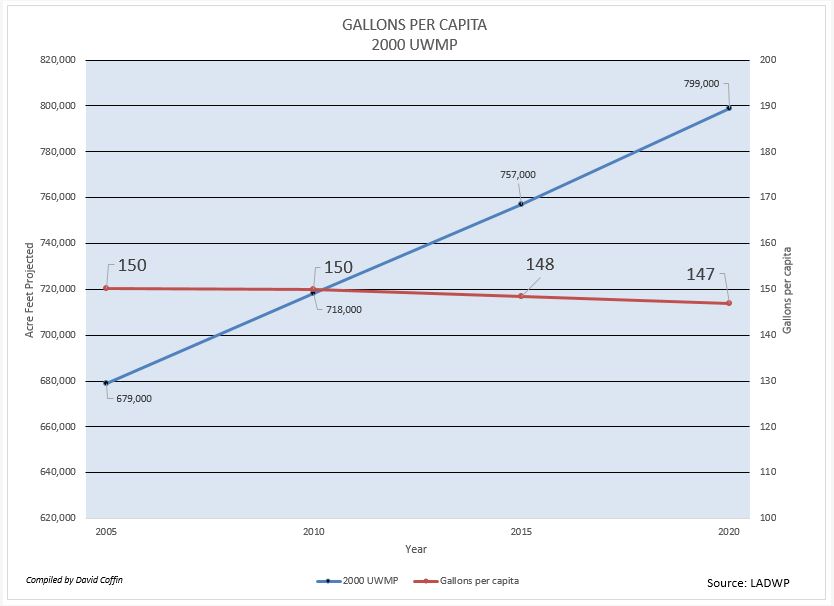
Figure 3 - Lower per capita and rising demand

L.A.'s fourth water plan might best be known as having to largest projected supply that the DWP said it could meet of any of the city's UWMP's. This monster projection occurred even as the department further reduced the gallons per capita daily water supply. The reasons were due to estimated population projections supplied by SCAG.

The new SCAG population estimates started out at 4,035,305 by 2005 population and would grow to 4,856,887 by 2020. These new population figures when figured into the new per capita allocations created a demand that would skyrocket to almost 800,000 Af/y.

The 2000 UWMP lowered the 'year 2005 supply per capita' of the previous plan from 154 to 150 gallons per day and from their it would ratchet down the consumption further to 147 gallons per day by 2020. (Figure 3)

But the lower allocations would still generate a sharp rise in demand. The DWP said it could supply 718,000 Af/y of water in 2010 and sharply increase in to 799,000 Af/y by 2020. The increase though didn't come from increased recycle and groundwater.

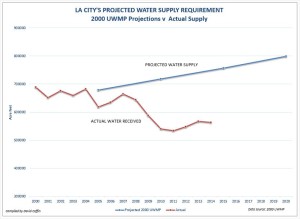
Figure 4 - 2000 Projection vr. Supply

Perhaps realizing that developing a recycled water system and pumping more groundwater was not paying the dividends they predicted earlier, the city ended its long standing resistance to relying on pricier MWD water and would ratchet up purchases of water from 200,000 to 298,650 Af/y which would nearly equal the aqueduct supply level.

Planners were forced to lower the recycled water projections 28% from 38,000 to 29,350 Af/y. Groundwater projections fell only slightly from 152,000 to 150,000 Af/y but aqueduct projections fell significantly from 360,000 Af/y to 321,000 Af/y.

The historical significance of the 2000 UWMP was that the DWP would only be able to deliver an average of 617,000 Af/y from 2000 to 2014 which was well under the promised 757,000 Af/y by 2015 and light years from the 799,000 Af/y it said it would have in 2020 to meet the city’s growth. (Figure 4)

NEXT:  2005 and 2010 UWMP's

Promise of Backup Water Not Met by DWP

Published / by dcoffin / Leave a Comment

Construction projects going through the city permit process are required to cite how much water demand they will impose on the city's water supply and whether the city has surplus water supplies to accommodate the project.

2010
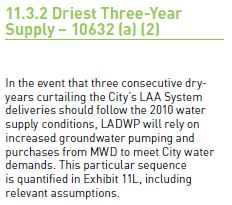
2010 UWMP states that MWD would make up for city shortfalls.

This information is provided in the EIR (Environmental Impact Report) which is part of the permit package for the project. The EIR's have a section on 'Utilities' stating where this surplus water will come from. As evidence of sufficient surplus water, the EIR's refer you to the city's current UWMP as evidence. The UWMP also describes how it will meet demand should there be a shortages of city owned water. When water shortages occur the city's water plans state that they have access to MWD supplies that will meet the city's level of demand.

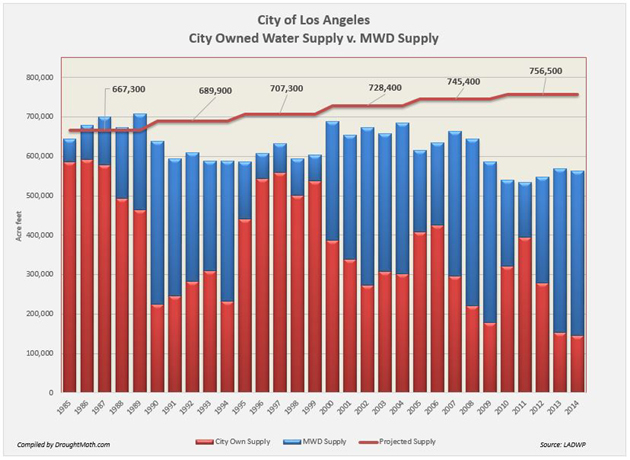
The chart below shows us that despite the UWMP's guarantee that the Metropolitan Water District will be able to provide sufficient water supply in dry years, the DWP has not been able to meet that guarantee since MWD supplies have come up short of the projections every year since 1990.

The deficit the city finds itself in is a result of this gap. Because this has been allowed to occur for twenty five years and never corrected in each subsequent UWMP,  we have to assume that these statements in the UWMP assuring that MWD will meet demand are mainly intended to facilitate approvals and nothing more. As such, it is a planned deficit.

MWD supplies have not been sufficient to meet the city's demands.
MWD supplies DWP water during shortages but has not been enough to meet the city's demands.

Paper Water is No Small Change

Published / by dcoffin / Leave a Comment

The City of Los Angeles water plans in the past have projected significant amounts of water that later never came. These large sums of water have been used to approve small and large projects going back to 1990.

When projects are reviewed by city planners, the figures cited in the city's water plans are supposed to assure the community that there is sufficient water for the project over the next 20 to 25 years after they are approved and that the project will not pose a burden to the city's water supply during that period.

LAfacade628

Over a 24 year period, this missing water would be equivalent to 4.35 million acre feet which is slightly more than a full years worth of California Aqueduct water at full allocation.

Urban Planning Meetings Rarely Discuss Water Supply

Published / by dcoffin / Leave a Comment

L..A's recent drought has been going on far longer than the statewide drought. California's last drought was declared in 2008 and it ended in 2011 then re-declared it in 2014.  L.A's drought was declared in 2008 and was never rescinded. So why has L.A.'s drought been so persistent and growing by the day?

The City of Los Angeles has been pretty effective at hiding the problem from the standpoint of planning. And Neighborhood Councils? Forget about it.

Having been to many planning and land use meetings where new projects come up for discussion and a vote, I can't remember any time that water was ever brought up during the question and answer periods except for the times I brought it up like here and here and here.

My experience is that few if any city council members or neighborhood council members know anything about the Urban Water Management Plan, Water Supply Assessments, or SB 610 or 221.

During these meetings the discussion around projects generally revolves around the height of the project, the traffic impacts of the project, traffic studies, and finding ways to mitigate the impact of the additional of 2000 or so vehicle trips that the project will generate daily. From there the are discussions go on to window heights, set-ins, low income units, etc., but not water is never discussed.

All of those these other issues are really quite local (though traffic clearly has a cumulative effect over the region) and most can presumably be mitigated. Help with mitigation its usually provided by a deputy council member or staffer from the councils office who step's in and suggests how these things can be addressed by the city such as adding thirty seconds to a stop light or adding a left turn lane.

What is never talked about is water supply. Water is something that really can't be mitigated anymore since there are no more William Mulholland's and now it has become a zero sum issue.  It's easy to see why the city would rather talk about traffic, construction, building height's since people are more familiar with those things and those issues are arguably solvable.

Water on the other hand pulls into the discussion something that is far more regional and can't be mitigated. The city of Los Angeles has a history of saying it has water for these projects when it really doesn't. So they want the issue to stay behind the curtain. Projects usually describe the city's water supply in environmental documents behind statements like this:

lagado
A typical project environmental report declares that water is not a problem.

People should be demanding that local planning committees and councilmembers to take water supply more seriously and ask more questions before giving the green light to projects in areas with diminished resources.

Dissecting L.A’s Paper Water – Recycled

Published / by dcoffin / 1 Comment on Dissecting L.A’s Paper Water – Recycled
One prominent member of the City of Los Angeles's 'paper water' portfolio is recycled water. Like L.A.'s groundwater supply, its Urban Water Management Plans between 1990 and 2005 had projected rapidly growing recycled water supplies that would never be realized.
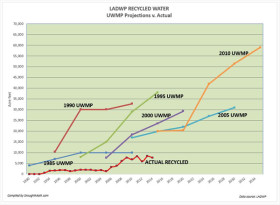
Recycle Water Projections versus Actual Supply
Recycle Water Projections v. Actual Supply
The chart at the right plots the huge gap between the actual recycled water supply the city had access to and the anticipated supplies that each UWMP projected. The gap between the two is the paper water that would be used to as evidence that medium and high density projects going through the planning process would have sufficient water when in fact they didn't. For example when we look at the 1990 UWMP projections, the city expected that its program for recycle water supply would triple within 5 years and eventually provide the city with over 30,000 af/y in 2000. This never happened. When the following 1995 UWMP came out it didn't begin where the 1990 plan left off. If fact it would cite less water in 2000 than the '90 plan which suggests that the effort to increase recycled water was making no progress. Of course paper water being what it is, that plan would still suggest (with no factual basis) that recycled water would still triple, this time within 10 years and then more than quadruple to 38,000 af/y within 15 years. The next 2000 UWMP was no different, it would also start off with less water than the preceding plans had projected and then nearly quadruple within 15 years with supplies approaching 30,000 af/y.
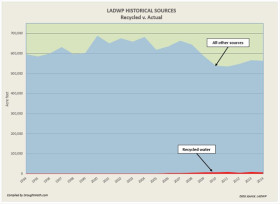
Recycled water supply versus total supply
Recycled water supply v. total supply
Little progress meeting past targets The actual supply between 1985 and 2010 hasn't been nearly so grand as the city's expectations and glossy presentations that suggested that recycled water would help the city meet its needs. The actual recycle water supply between 1995 and 2005 was so tiny at just 1,748 af/y and was barely perceptible on a chart. Between 2006 and 2014 the city's recycle supply would grow to just 6,410 af/y which is far below any of the past UWMP projections that ranged from 19,950 af/y to 38,000 af/y and light years behind the projected 850% increase now cited in the 2010 UWMP to 59,000 af/y by 2035. This huge gap between 'projected or anticipated supply' and 'actual supply' is an unfortunate characteristic of the city's water supply we would call paper water. It's a promise spanning 5 water plans and 25 years that was used to mischaracterize the city's supply to approve high density development. The gap has only widen between 1990 and 2015 and given the city's history of meeting its projections, I don't have much faith that it will meet the 59,000 af/y target it has set for 2035. If it could have met the much lower targets it had set in earlier plans, it would have done so by now. However the obstacles such as trying to roll out a citywide network of purple pipe were just to huge to overcome.

L.A.’s History of Paper Water

Published / by dcoffin / Leave a Comment
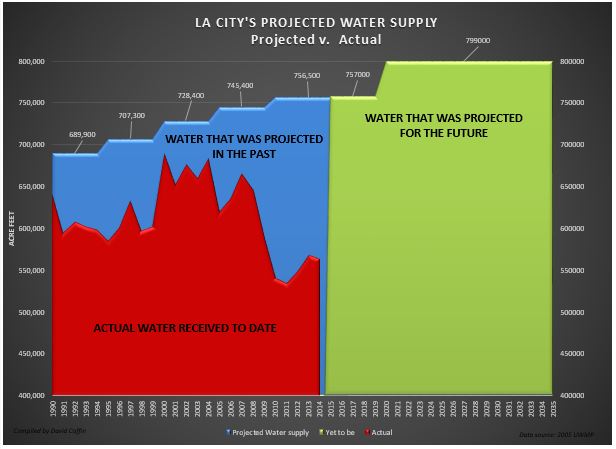
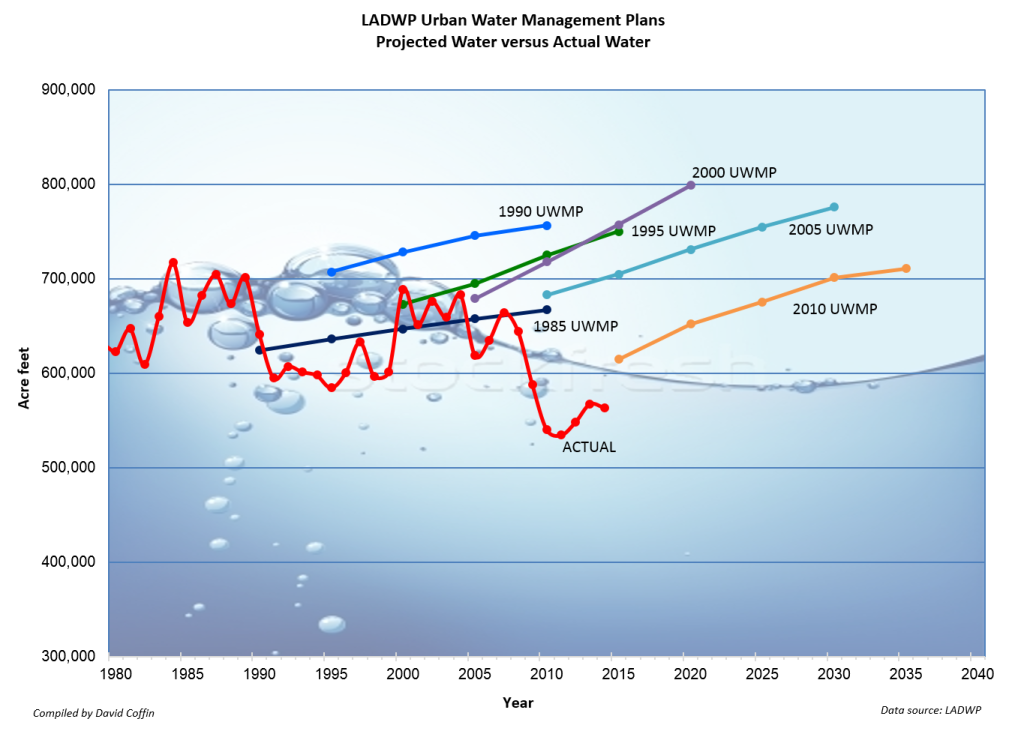
This graph shows the City of Los Angeles's history of 'paper water' since 1990 and the actual amount of water it has been able to obtain. Paper water is the gap between what the city anticipated it would need for it future growth versus the amount of water it actually received. The projections appear in the city's Urban Water Management Plan (UWMP) which is published and approved by the city council every five years. The city uses paper water along with real water to demonstrate that it has sufficient water supplies for the thousands of medium and high density projects going through the planning process. As time goes by however the city has not been able to access that water which has created a severe deficit resulting in a drought. Despite not having access to this water, each new water plan continues to anticipate levels of water supplies that it clearly has no access to. Residents caught in the middle of this vicious drought/growth cycle and have been forced pay for this policy with higher utility prices, enforcement actions, and lower property values.
uwmpperf
Chart showing the gap between actual supply the city receives and anticipated supply projected in each UWMP.
 
301 Moved Permanently

301 Moved Permanently


nginx/1.18.0 (Ubuntu)