Tag: Recycle

Purple Pipe Doesn’t Live Up to Hype

Published / by dcoffin / Leave a Comment

LADWP water plans are generally more about perception than results and 'Purple Pipe' is certainly the poster child proving that.

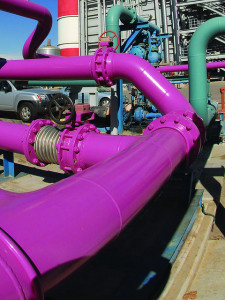
Purple pipe is used to distribute non-potable recycled water and is often presented as one of the departments cornerstone resources to meeting the city's water supply demand since it frees up potable water that would have been used for irrigation or industrial use. Thumb through many of the DWP’s presentations and you'll find impressive glossy photos of purple pipe that suggest that it's been making big contributions to increasing the City of Los Angeles water supply. Even the Mayor and the city’s neighborhood councils are lulled into this group think.  

purple pipe
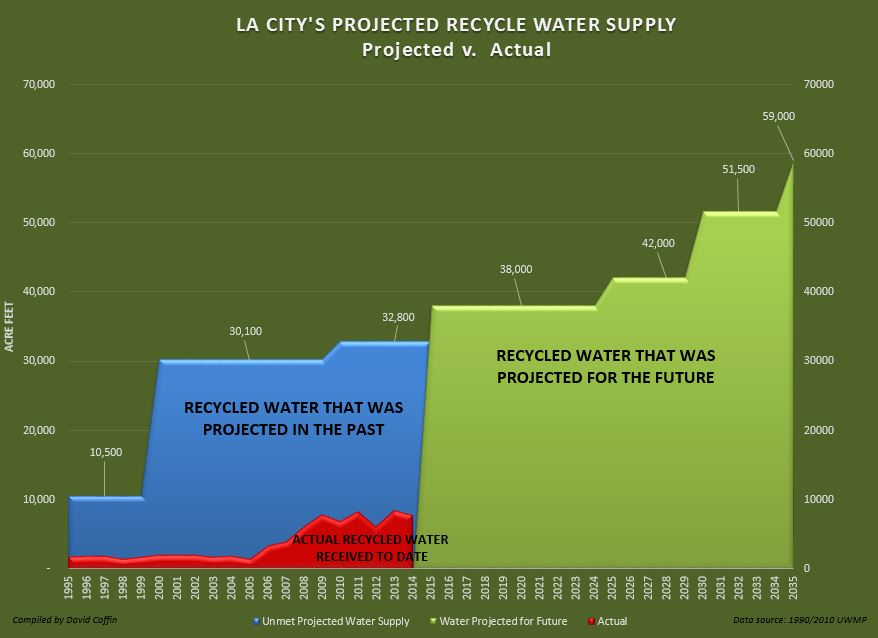
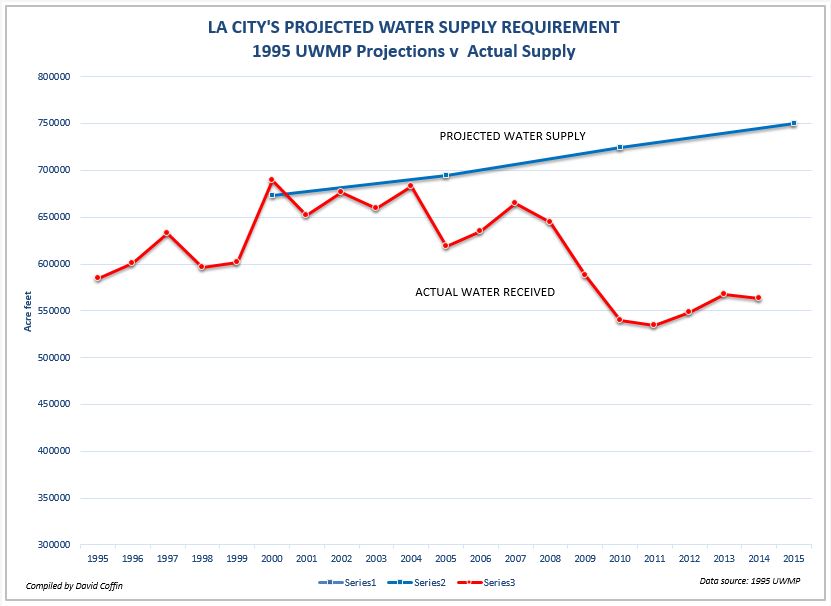
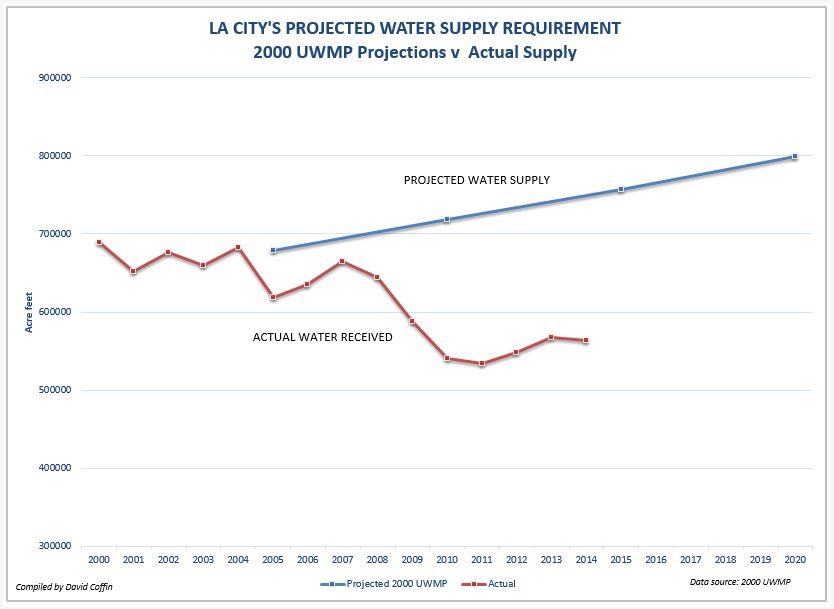
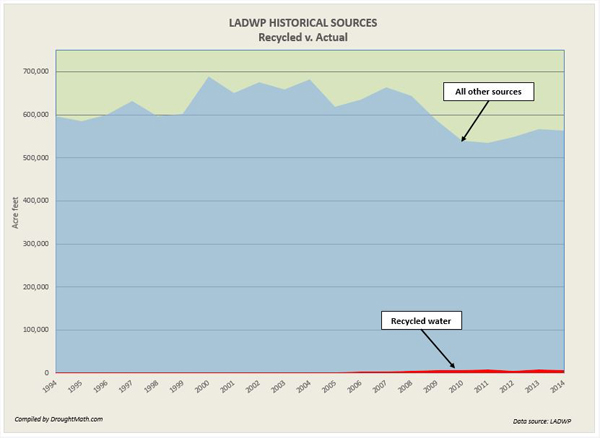
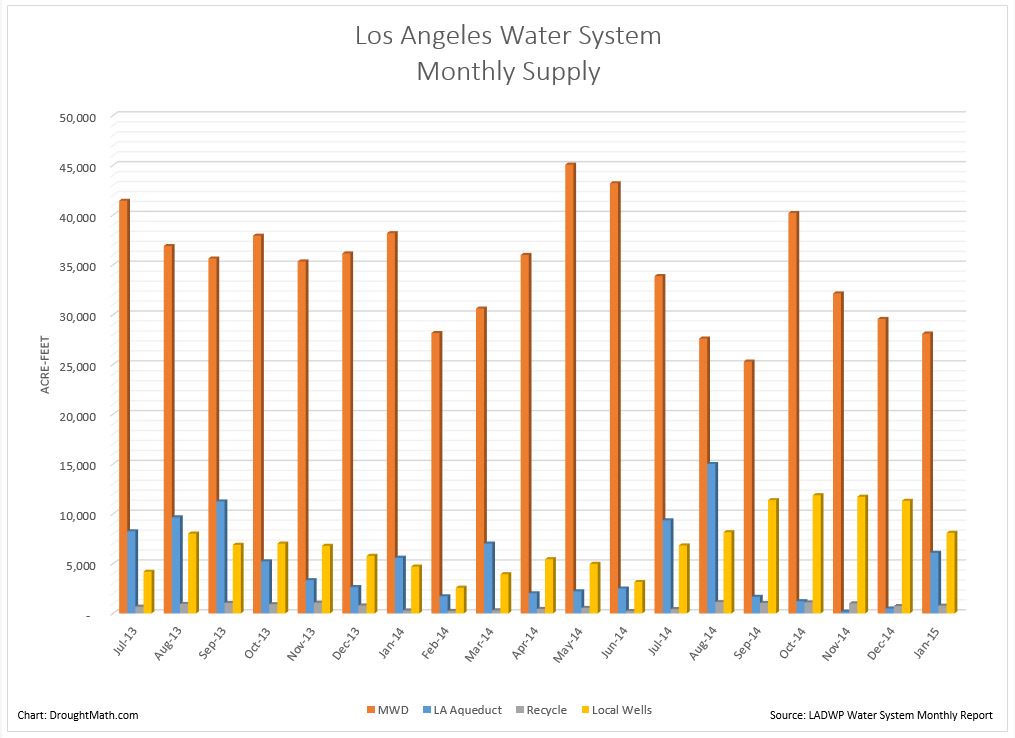
However when perception meets gritty reality, purple pipes contribution to the city's water supply is simply underwhelming and not deserving of so much attention. Past LADWP water plans told us recycled water was supposed to deliver be delivering ~30,000 Af/y to the city by 2015. But instead the city's been getting an average of only 7,600 Af/y.

There are several reasons for this shortfall, the biggest being the same reason the city isn’t able to effectively replace its aging water mains. The immense cost of such an effort and the disruptive nature of digging up thousands of miles of city streets in a city that is already built out and paved over is prohibitive. The department says it would take 300 years to replace its crumbling water mains. Building a distribution network of purple pipe runs into the same problems of cost and disruption.

This leaves the department to choose routes where it can get the most bang for its buck. Generally this means it has to be a customer who can use lots of recycled water and is relatively near by the filtering plant. In the city's west side for example, only a few customers like LAX, Westchester Golf Course, Loyola Marymount and Playa Vista fall into that category.

Sure it would be nice to have purple pipe running alongside the city's water mains that finally connects up to every large commercial and residential complex but that's not going to happen.
recycle

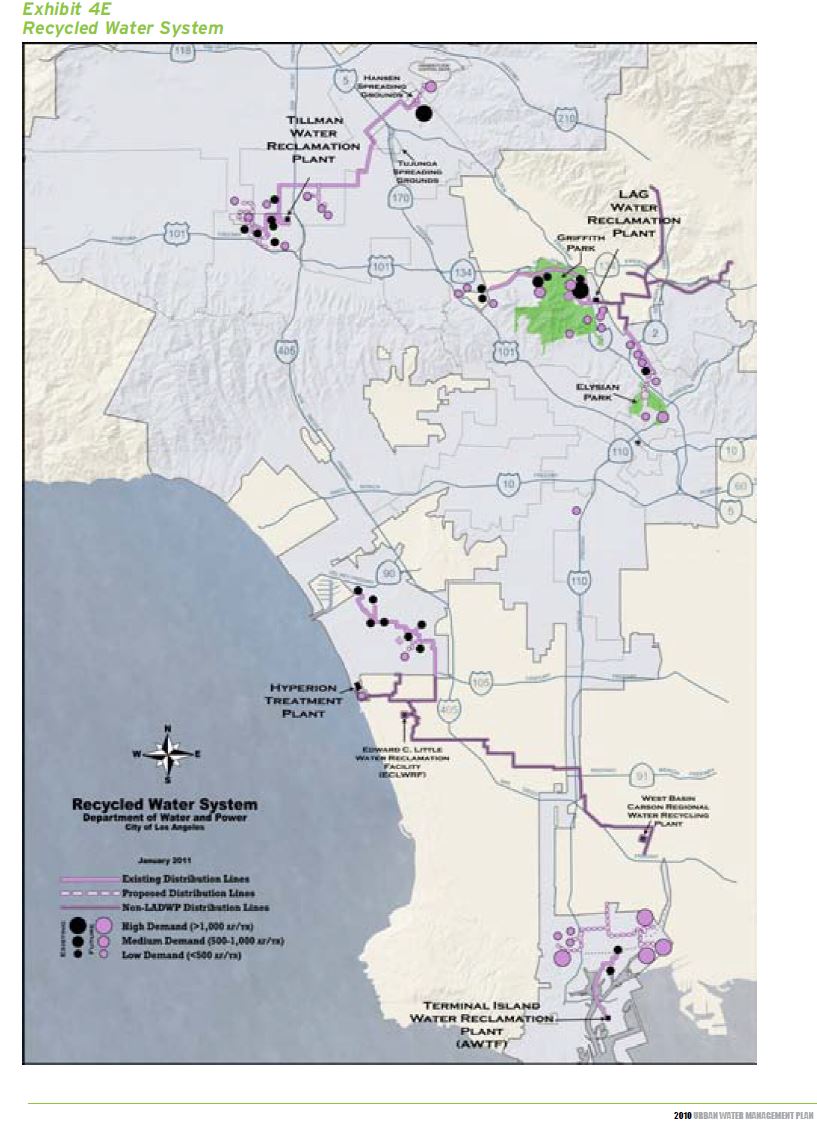
The other reason for the lack of progress is that recycled water is primarily for irrigation and industrial use. In the 1980's the city's industrial use was ~30,000 Af/y but overtime this has fallen to an average of just 19,000 Af/y. The rest would go to city parks, golf courses and new commercial/residential developments that are close enough to filtering plants that makes it economically viable to tear out a few streets and lay new purple pipe.

This is not a growing customer segment that justifies the departments claim that it will increase recycled water to 42,000 Af/y by 2025 and 59,000 Af/y by 2035.

The WSA – Bringing Imaginary Water to L.A.’s Big Projects

Published / by dcoffin / Leave a Comment

In a previous article I wrote that The Los Angeles Department of Water and Power was confronted with two conflicting demands that dates back to 1990. The department’s conflict is between providing enough water to city residents from a rapidly shrinking water supply that once averaged 680,000 Af/y and is now just over 610,000 Af/y and then also show evidence that the city’s water supply is growing to assure continued growth. 

By now most of the public is well aware that there is a water shortage and that the DWP has been furiously trying to reduce the city’s residential per capita consumption by bombarding the media with accounts of shortages, imposing emergency drought restrictions, ‘drought shaming’ residents into using as little water as possible, and even paying them to tear out lawns and substitute it with drought resistant landscaping.

What the public is not aware of is that the LADWP puts on a very different face when it comes to assessing demand and assuring water supply for large new projects that consume the equivalent of 500 units or more in its Water Supply Assessments also known as WSA’s. Performing a water supply assessment is required by state law for very large projects and the department has produced more than seventy of them since 2005.

You need water? We got the water! Step Right in line.

1444 unit SOLA Village ProjectThe DWP’s water assessments are akin to a Hollywood movie set whose front facing facades of old western towns look like the real thing but when you step through a door all you find is an empty lot.

Read through a WSA and you’ll be transported into a parallel world where there’s plenty of surplus water to support a projects demand for the next twenty years along with all the other planned future demand that don’t trigger water supply assessments. But look behind the report at the actual supply figures and you’ll find that like the old western town on the big screen, the WSA is a mere facade as well.

Let’s take a recent example of the large 1,444 unit downtown SOLA Village project that the LADWP recently recommended to the Board or Water and Power for approval. Keeping in mind that the City of Los Angeles is already reeling from a water shortage and has been since 1990, the DWP’s Water Resources Section concluded in the projects water supply assessment that “adequate water supplies will be available to meet the total additional water demand” and that the demand “can be met during normal, single-dry, and multi-dry water years” for the next 20 years!

The department came to this conclusion by citing water demand and supply forecasts from its own current Urban Water Management Plan. A practice that is allowed by the state but should bring to question the sincerity to the laws “Show Me the Water” hype.

unmetRCYThe city’s past water plans have always claimed to have access to amazing amounts of water but in reality its water that can never be delivered or touched. You’ll never be able to wash your hands with it or sip it from a glass. Its imaginary water destined only for the pages of WSA's and UWMP's that are used to approve projects by decision makers.

For instance, supporting the SOLA Village project, the WSA cites that over the next twenty years the department will be able to build up recycled water supplies “eight-fold” to an amazing 59,000 Af/y by 2035. The problem however is that they’ve made similar claims to this in every preceding water plan going back to 1990!

The 2010 and 2005 plans that are routinely cited in the city's WSA’s both stated that we would be enjoying 20,000 Af/y of recycled water by 2015! In reality though, we’ve only seen an average of 7,392 Af/y since 2005 and we missed the 2015 target by 13,000 AF or 4.2 billion gallons.

Touching on another source of water, the SOLA Village WSA goes on to claim that stormwater capture will increase the water supply by 25,000 AF. Stormwater capture while not new, has been getting a lot of press attention lately when it was singled out by the city as a promising groundwater recharge component that would increase supplies.

But stormwater capture along with groundwater is highly speculative and certainly not sustainable on a year-to-year basis given the whims of Mother Nature. We can only look at averages and the averages have never been good to WSA’s when you look at them historically.

Certainly the city could bump up groundwater recharge with larger catch basins but rain barrels? Seriously? The departments WSA suggests that 10,000 Af of the 25,000 AF total would be met by rain barrels and cisterns. It would take 65 million of those plastic 50 gallon barrels that cost residents about $100 to buy. I suspect that the DWP is perhaps leaning towards underground cisterns to capture some of that water. But how would we know? WSA doesn’t positively identify how many or where these cisterns will be located. It just throws out the claim. WSA’s are supposed to “Show Me the Water” as the law was named, not make empty promises.

unmetGWContinuing on empty promises, groundwater has always been the department’s go-to resource when you need to bump up imaginary water. The SOLA Village WSA benefits in this trend by citing wild groundwater claims that states the department will be able to deliver more than 100,000 AF year-after-year. However, so did literally every plan before it.

Since 1990 the DWP’s Water Systems Section has repeatedly claimed the city would be receiving an average of 100,000 AF or more each year but that was never met. The WSA doesn’t tell you that. The city’s average yield has been just 67,000 Af since 2000. The WSA also doesn’t tell you that. It doesn’t tell you that only three times since 1990 has it ever exceeded 100,000 AF. It doesn’t really tell you we really don’t have enough water for these projects.

Susceptible to Challenge                                                              

Given the way the department carelessly cites access to large sums of unobtainable water to shore up evidence of sufficient supply, this makes WSA susceptible to challenge. WSA’s are a requirement of SB 610 and SB 221 which are collectively known as the “Show Me the Water Laws” but  LADWP’s WSA’s plans have not done that since 1990.

The Paper Water Years – LA’s 1995 – 2000 Water Plans

Published / by dcoffin / Leave a Comment

This is Part IV in a series describing L.A.’s water supply problems and the policies that produced it.

1995CoverIn Part III we saw how the city sought to maintain the 1985 baseline of ~175 gallons per capita daily in the 1990 UWMP while population estimates increased. As a result we saw the projected supply in the plan jump significantly from the previous plan. We also found that the DWP heavily leveraged the projected 1990 supply in the groundwater and recycled categories using water it had no chance of getting. These factors continued into the 1995-2000 UWMP's. 

The 1995 UWMP - L.A.'s 3rd Water Plan
The 1995 UWMP should best be known by the city’s acquiescence that water supply had its limits. Population estimates from the Southern California Association of Governments (SCAG) did not climb as dramatically as they had in the 1990 plan but the increase from 3.85 million to 4.25 million by 2015 (9%) was still the driving factor.

With future growth estimates continuing to drive the supply requirement of more water, DWP planners were forced to set a new precedent by reducing the per capita supply from 177 gallons per capita to 150 gallons acknowledging that less water would be coming through the Los Angeles Aqueduct due to recent court ordered restrictions of Mono Basin water and at current allocations, future growth would have demanded ridiculously large amounts of water that couldn’t be met.

1995GPC
Figure 1 - Big jump to reduce per capita supply

If the DWP planners tried to sustain the 177 gallons per day cited in the 1990 plan, the projected supply in the new plan would have shot up to 757,000 for 2000 and risen to 886,000 acre feet per year (Af/y) by 2015!

Historically though, reducing the per capita supply to 150 gallons per day per capita would not be enough. At this allocation the DWP suggested that it would have 695,000 Af/y by 2005 and could gradually increase that to 750,000 Af/y by 2015 (Figure 1). But in the years following the approval of the plan, the actual supply figures that came in would demonstrate the DWP's failure to achieve these projections suggesting that there was far too much paper water in the projections to be viable.

DWP planners accepted that less water was going to be available through the aqueduct system and reduced the aqueduct supply by 20,000 Af/y to 360,000 Af/y in the 1995 plan.

1995PW
Fig. 2 - 1995 Projections vr. Supply

To offset the loss of aqueduct water, DWP planners suggested that they could increase the already large projections of the 1990 plans and increase the availability of recycled water to 38,000 Af/y, and groundwater to 152,000 Af/y.

Through the years though, none of these figures would ever be achieved. Recycled water averaged a mere 2,300 Af/y and groundwater averaged just 87,000 Af/y proving the plan wasn’t working.

The historical significance of the 1995 plan was that the DWP would only muster up an average of 638,490 Af/y (Figure 2). Far less than the 750,000 Af/y that it promised. Because of the paper water fueled growing deficit, the DWP would start prodding the public into reducing its demand using such schemes as tiered pricing, washer rebate programs and require that all homes install low-flow toilets before resale.

The 2000 UWMP - L.A.'s 4th Water Plan

2000GPC
Figure 3 - Lower per capita and rising demand

L.A.'s fourth water plan might best be known as having to largest projected supply that the DWP said it could meet of any of the city's UWMP's. This monster projection occurred even as the department further reduced the gallons per capita daily water supply. The reasons were due to estimated population projections supplied by SCAG.

The new SCAG population estimates started out at 4,035,305 by 2005 population and would grow to 4,856,887 by 2020. These new population figures when figured into the new per capita allocations created a demand that would skyrocket to almost 800,000 Af/y.

The 2000 UWMP lowered the 'year 2005 supply per capita' of the previous plan from 154 to 150 gallons per day and from their it would ratchet down the consumption further to 147 gallons per day by 2020. (Figure 3)

But the lower allocations would still generate a sharp rise in demand. The DWP said it could supply 718,000 Af/y of water in 2010 and sharply increase in to 799,000 Af/y by 2020. The increase though didn't come from increased recycle and groundwater.

Figure 4 - 2000 Projection vr. Supply

Perhaps realizing that developing a recycled water system and pumping more groundwater was not paying the dividends they predicted earlier, the city ended its long standing resistance to relying on pricier MWD water and would ratchet up purchases of water from 200,000 to 298,650 Af/y which would nearly equal the aqueduct supply level.

Planners were forced to lower the recycled water projections 28% from 38,000 to 29,350 Af/y. Groundwater projections fell only slightly from 152,000 to 150,000 Af/y but aqueduct projections fell significantly from 360,000 Af/y to 321,000 Af/y.

The historical significance of the 2000 UWMP was that the DWP would only be able to deliver an average of 617,000 Af/y from 2000 to 2014 which was well under the promised 757,000 Af/y by 2015 and light years from the 799,000 Af/y it said it would have in 2020 to meet the city’s growth. (Figure 4)

NEXT:  2005 and 2010 UWMP's

Dissecting L.A’s Paper Water – Recycled

Published / by dcoffin / 1 Comment on Dissecting L.A’s Paper Water – Recycled
One prominent member of the City of Los Angeles's 'paper water' portfolio is recycled water. Like L.A.'s groundwater supply, its Urban Water Management Plans between 1990 and 2005 had projected rapidly growing recycled water supplies that would never be realized.
Recycle Water Projections versus Actual Supply
Recycle Water Projections v. Actual Supply
The chart at the right plots the huge gap between the actual recycled water supply the city had access to and the anticipated supplies that each UWMP projected. The gap between the two is the paper water that would be used to as evidence that medium and high density projects going through the planning process would have sufficient water when in fact they didn't. For example when we look at the 1990 UWMP projections, the city expected that its program for recycle water supply would triple within 5 years and eventually provide the city with over 30,000 af/y in 2000. This never happened. When the following 1995 UWMP came out it didn't begin where the 1990 plan left off. If fact it would cite less water in 2000 than the '90 plan which suggests that the effort to increase recycled water was making no progress. Of course paper water being what it is, that plan would still suggest (with no factual basis) that recycled water would still triple, this time within 10 years and then more than quadruple to 38,000 af/y within 15 years. The next 2000 UWMP was no different, it would also start off with less water than the preceding plans had projected and then nearly quadruple within 15 years with supplies approaching 30,000 af/y.
Recycled water supply versus total supply
Recycled water supply v. total supply
Little progress meeting past targets The actual supply between 1985 and 2010 hasn't been nearly so grand as the city's expectations and glossy presentations that suggested that recycled water would help the city meet its needs. The actual recycle water supply between 1995 and 2005 was so tiny at just 1,748 af/y and was barely perceptible on a chart. Between 2006 and 2014 the city's recycle supply would grow to just 6,410 af/y which is far below any of the past UWMP projections that ranged from 19,950 af/y to 38,000 af/y and light years behind the projected 850% increase now cited in the 2010 UWMP to 59,000 af/y by 2035. This huge gap between 'projected or anticipated supply' and 'actual supply' is an unfortunate characteristic of the city's water supply we would call paper water. It's a promise spanning 5 water plans and 25 years that was used to mischaracterize the city's supply to approve high density development. The gap has only widen between 1990 and 2015 and given the city's history of meeting its projections, I don't have much faith that it will meet the 59,000 af/y target it has set for 2035. If it could have met the much lower targets it had set in earlier plans, it would have done so by now. However the obstacles such as trying to roll out a citywide network of purple pipe were just to huge to overcome.

L.A.’s First Water Plans – The 1985 & 1990 UWMP

Published / by dcoffin / Leave a Comment
In 1983 the State of California passed the Urban Water Management Plan Act that required water suppliers to provide a water plan every five years. 1985UWMPCoverThe Urban Water Management Plan (UWMP) is rich in information as it identifies the agencies sources of water (aqueduct, groundwater, imported), amounts of water available from these sources, methods of conveyance, current and future water uses, projected demand, current and future conservation methods, demographics, population density and growth, housing mix, commercial/industrial/governmental demand, etc. The importance of the UWMP is that it is used as a guideline for making public decisions concerning water and is cited in planning documents, water supply assessments. But the UWMP can also be seriously misused when 'paper water' is inserted into the plans which provides a misleading assessment of the water supply or when city officials simply rubber stamp the findings without any sort of reassessment given current water supply availability. The City of L.A.'s UWMP's are both fascinating and disappointing in that they paint a picture of great expectations, a long term failure to meet demand and worse, a misleading assessment of the city's true water supply. What follows is a retrospective look back at previous UWMP's. What we find is a blueprint to a permanent water deficit. The 1985 UWMP - L.A.'s First Water Plan
Figure 1
The 1985 UWMP was the first state mandated water plan published by LADWP. This first time report was an honest and useful assessment of the city's water supply at the time. The plan assumed the city would receive a constant 470,000 Af/y supply through the Los Angeles aqueduct, 103,000 Af/y of groundwater and a small but growing reliance on MWD water between 1986 through 2010. From a planning perspective the most important part of the UWMP are the tables that show the projected water requirements at 5, 10, 15, and 20 increments for average years. The tables break down how much water the city assumes it will receive through the aqueduct, local groundwater, MWD, and recycled water. It's important that these projections meet the actual supply 5, 10, 15, and 20 years later because they are used in environmental impact reports and water supply assessments as guidelines for future development. If the actual supply doesn't meet the projections then we can assume we are creating a water supply deficit. (more…)
301 Moved Permanently

301 Moved Permanently


nginx/1.18.0 (Ubuntu)