Tag: SB 610

Show Me the Water‘s Failed Promise – The Newport Banning Ranch File

Published / by dcoffin / Leave a Comment

It’s bad enough that water utilities project far more supplies than they have access to which by definition is paper water. It's bad enough that using this imaginary water they always come to conclusion that every project requesting a WSA has sufficient water to proceed. But recently it became clear to me that are other forms of paper water that comes in large amounts as well. Paper water by definition is water the city says it has available to it, but it can never access because it’s being used by someone else within the state's water system.
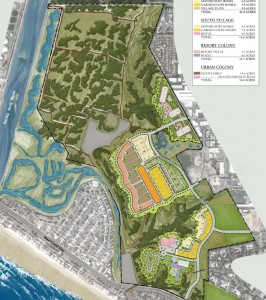
nbr2In July I was asked by the Banning Ranch Conservancy to look at the Newport Banning Ranch water supply assessment as they prepared for a California Coastal Commission meeting on the project. Having reviewed quite a number of Los Angeles Department of Water and Power water supply assessments I knew the first place to look for paper water would be in found in the utilities projections. Over time I've suspected there were other areas where paper water could be found but L.A.’s sheer size made it difficult for me to validate those.

Reviewing this projects WSA was a good opportunity for me because it is more typical of WSA’s that are produced throughout Southern California and the city’s relatively small population also made it easier to see whether housing growth can contribute to paper water ‘surpluses’ under SB 610.

For a little background, the Newport Banning Ranch (NBR) project is a proposed 1,375 housing unit development in the City of Newport Beach that also includes commercial. The city’s water supply is quite a different from the City of Los Angeles's water supply in that groundwater clearly is a substantial portion of the city's water supply. Newport Beach does not have its own domestic ground water supply underfoot but instead it has four wells that are located are located about five miles away in Fountain Valley which are managed by the Orange County Water District. When ground water is in short supply the city buys imported water from MWDOC.

When I dug into the Newport Banning Ranch WSA I found it was similar to the water supply assessments that are routinely produced by the LADWP. The Newport Beach water supply assessment relies heavily on 'paper water' to create a façade of surplus water just like L.A.'s water supply assessments. When reviewing the city’s sources of water supply, I found that they never met their respective supply projections and there was no chance that they ever would. 21 percent of the city’s projected water supply was water that the city didn't have access to. Hence it was ‘paper water.’

Growth’s Contribution to Paper Water

But there was more. What about housing that doesn’t trigger SB 610 requirements for a WSA? Failing to report cumulative housing construction would be another form of paper water. If a WSA doesn’t acknowledge that new housing has been constructed since the city’s Urban Water Management Plan was approved, the water demand from the unrecognized housing would be viewed as a unused water that is still available for new projects.
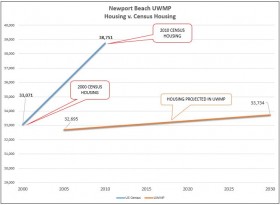
NBR2The Newport Banning Ranch water supply assessment was based on an increase of just 1,039 housing units over 20 years. That figure came from the city’s Urban Water Management Plan which in turn comes from the RHNA allocations that are imposed on cities. A subject that I’ve written about extensively here.

Right off the top, the NBR project's proposed 1,375 units exceeds the city’s 20-year water plan by 336 units meaning that new water supplies should have been identified in the WSA.

But that led me to the next question. Aside from the fact that the project is larger the city’s projected housing growth, how many units were built in the city since 2005 that did not trigger a water supply assessment? The answer was stunning.

In just five years the city’s rise in housing exceeded the UWMP's 20-year projected growth by 380% or 5,017 units and there was still fifteen years to go. The extent of this growth really surprised me. I didn't expect that growth could be so under-projected in a UWMP that it would decidedly tip the scale towards insufficient supplies in just five years. Shouldn't a water supply assessment capture this demand on water supply? I think so. You can't say your Showing Me the Water if your not disclosing the demand.

Not surprisingly, the water supply assessment didn’t acknowledge this new housing so this water could be viewed as an unused surplus. The project's WSA simply ignored the new housing. Had it acknowledged that the city had grown, it may have created pressure on the developer to find new water supplies. The Show Me the Water Law is supposed to link large projects to water supply. It should also assure that large projects are not be claiming to have access to water already that has already been committed elsewhere.

SB 610’s silence on projects that are less than 500 units effectively guts the law. The law only says that a WSA must include a ‘discussion’ of various elements of the water supply such as total projected supply during normal and dry years. The law doesn’t explicitly point out that the discussion should include housing growth that was not accounted for in the UWMP. Another weakness in the law is that it doesn’t have any regulatory oversight. This leaves it up to citizens to have to challenge water supply as it appears in an EIR.

The law should be expanded to require cities to keep a running total of new demand for recently approved projects that do not trigger a water supply assessment and incorporate that into all EIR’s. And while its keeping a running total of demand, it should also inform citizens on what that increasing demand will do to their monthly water allocations and rates.  

This would give decision makers a little more information that might help eliminate any water shortage surprises should the increase in projected housing exceed the projected increase in the UWMP.

NBR’s other Imaginary Water
NBR1Aside from the WSA’s failure to mention new water demand from the city's ongoing housing construction, there were other problems with the Newport Banning Ranch WSA.

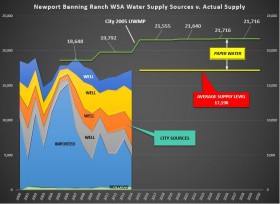
The WSA suggested that the city’s water supply would increase from 18,648 AF a year to 21,716 AF/y. This suggestion would lead the city's decision makers to incorrectly believe that supplies are increasing which would be sufficient for the projects proposed new housing. However a review of the city’s historical supply tells us another story. That there's little chance that the city's future supply will ever exceed 17,200 AF year-after-year or that it will ever see supplies exceed 19,000 Af in any one year.

What I found was that the total well water supply was not enough to meet the UWMP projected supply. Since 1990, OCWD groundwater allocations have been averaging about 72 percent. In the last 10 years that figure has dropped to 62%.

The WSA also suggested that during droughts when wells weren't producing sufficient supplies, the city would be able to make up for those shortages by purchasing imported water from MWDOC. The WSA even goes so far to state that MWDOC "was able to show that it can maintain 100% reliability in meeting direct consumptive demand under condition that represent normal, single driest, and multi dry years through 2030". However, the fact is that MWDOC doesn’t have enough water available for purchase to meet the city’s 21 percent shortfall even in wet years which is shown by the gap in the chart at the right labeled 'paper water'.

All Claims of Sufficient Water Supply Should Be Considered Suspect

The Newport Beach WSA isn't unusual. I suspect it's typical of water supply assessments produced throughout Southern California and maybe even Central California as well. The ‘Show Me The Water’ law requires that a water supply assessment be attached to the projects EIR when the project is 500 units or larger. While small and medium size projects do not require a water supply assessment, CEQA still has a requirement for an analysis on water supply in the Utilities section of the EIR.

The EIR merely has to refer to the local utilities UWMP to serve as an assessment for these projects. Whether the discussion of water supply is found in the WSA or the UWMP, there is a nearly 100 percent chance that the utilities water supply includes a substantial amount of paper water. All claims of ‘sufficient’ or ‘adequate’ water supply should be reviewed closely.

How Much Paper Water Costs

Published / by dcoffin / Leave a Comment

WSACoverCan you buy paper water? Absolutely.

Today the LADWP sent out an agenda for an upcoming meeting of the LADWP Board of Commissioners.  One of the agenda items on it was the NoHo West project Water Supply Assessment with a recommendation by LADWP Water Systems section for the Board to approve it. Like other WSA's this one is no different. The requirement for a water supply assessment comes from the California's 'Show Me the Water' legislation. This WSA like the other LADWP water supply assessments fails to do that.

Most urban water agencies like the LADWP have upended SB-610 and turned it into a pay to play permit that offers paper water to help approve projects for a fee. For $17,000 the department will produce a report full of Imaginary Water that will get your project approved. 

At that price you should expect a very elaborate highly detailed report but in reality the LADWP provides a little more than 20 pages of analysis along with 160 pages of poorly rendered photocopies that have little relevance to the projects analysis except for what the city Planning department provides. That comes out to about $800 a page. The rest of the report is primarily a crude cut and paste job that offers no extra insight to the water supply for decision makers to base their decision on.

If we break down the NoHo West WSA into simple little segments it goes like this:

The first 21 pages of the WSA goes on to describe the 742 unit project that's also full of retail and office space. It estimates how much water demand the project will impose on the city and it feigns on how much the extra conservation the LADWP was able to negotiate out of the developer to reduce demand. Not surprisingly it ends with a conclusion that this projects 298 Af/y is accounted for in the City's 2010 Urban Water Management Plan even though its not. This is essentially where the analysis ends.

At page 22 the department inserts twenty pages of stale, highly inaccurate supply projections into the report and goes on to describe the city's water supply infrastructure, environmental constraints and conservation measures. All of this information is already available in the City's UWMP.  

At page 51 the department inserts a letter from the City Planning Department that makes the request for the WSA. The Planning Department letter actually has more original material in the WSA than what LADWP contributes for its part.

At page 67 the department then inserts a few letters from the developers agent describing the various proposed alternatives for the project are inserted into the WSA.

$17,000 would seem to be an outrageous amount of money if it just ended there. So here the LADWP stuffs in a bunch of over copied, poorly rendered filler that adds little value to fatten up the report another 101 pages. None of this extra information provides anything useful for assessing whether the project might be an undue burden to the city's residents or if there really is sufficient water supply. In fact it may be a distraction meant to discourage the reader from seriously reading it and asking further questions during the approval process.

In this section we find what might be the most copied court judgement ever, the City's groundwater adjudication which claims what rights the city has to San Fernando Groundwater Basin. This document has little relevance to the NoHo West project. Its presence serves to give the reader the impression that the department has its act together even though it failed miserably in delivering what groundwater it claims it has to the city residents.

Then we get to page 88 for the obligatory piece of CA water code that requires retail water agencies like the LADWP to produce a water supply assessment for projects that are 500 units or larger just in case those projects are not accounted for in the city's UWMP. Despite the legislations name however, the LADWP doesn't really show us or the Board of Commissioners any water. Just paper water.

Then we get to the biggest chunk of this cut and paste job because the report is still pretty thin. The Metropolitan Water District should get royalties on these 86 pages each time it shows up in a WSA. Oddly, this half of the WSA's 180 pages comes from the very agency the City says it doesn't need much anymore and it's going cut 50% of its purchases from. The MWD contribution is guaranteed to put any bureaucrat asleep since it's mostly devoted to bond money and negotiations with other water agencies to keep our reservoirs full. They are full aren't they?  

Despite the $17,000 price tag, it's money well spent for the projects developer. Even after two and a half decades of falling water supplies and emergency drought ordinances, that $17,000 buys them confidence that the LADWP will identify just enough paper water to usher their project through.  How good is that!


California’s Challenge to Reliable Water isn’t Infrastructure. It’s RHNA

Published / by dcoffin / 6 Comments on California’s Challenge to Reliable Water isn’t Infrastructure. It’s RHNA

The state’s biggest challenge in meeting the population’s water supply requirements isn’t conservation, it isn’t lack of infrastructure, not storage, and not groundwater. It’s RHNA, a little known wonkish piece of legislation embodied in Government Code 65580 that's mostly known to planners, developers and city hall staffers. 

What follows might sound like we’re veering away from the focus of this blog but stick with it, RHNA affects water demand (and electric power and traffic) in a very heavy handed, mindless way. You’ll see why.

State Level RHNA

RHNA (Regional Housing Needs Assessment) is a law that requires the state Department of Housing and Community Development (HCD) to establish the region’s existing and projected housing needs. RHNA prods and some might say it threatens cities into produce housing and while it presses for growth, nowhere in the state level is there an evaluation as to whether the water supply is available.

The RHNA process starts out with population projections generated by the state’s Department of Finance (DOF). These population figures are then sent to HCD which takes this data and develops regional housing (RHNA) allocations. The allocations, spread out evenly between Northern and Southern California, are distributed among 38 regional planning agencies through a RHNA Determination Letter.

Regional Level RHNA

Every region in the state has a planning agency that assigns housing allocations to the cities and communities they oversee. When regional planning agencies receive the Determination Letter, they take the regional RHNA allocations in it and break it down to city level RHNA allocations. When the HCD sent Southern California its Determination Letter showing RHNA allocations (pdf), the Southern California Association of Governments (SCAG) w­­­as assigned to provide between 409,060 and 438,030 housing units to be spread out among its 191 cities inside Los Angeles, Orange, Riverside, San Bernardino, Imperial and Ventura counties. The planning agency that represents San Diego (SANDAG) was assigned to provide 161,980 units.

To name a few other regions, if you live in Fresno its planning agency (FCOG) was assigned a RHNA allocation of 41,470 housing units. Kern’s planning agency (KCOG) was assigned a RHNA allocation of 67,675 housing units and the San Francisco Bay Area agency (ABAG) was allocated to provide for 187,990 new units. Regional planning agencies simply accept the HCD numbers at face value.

This step in the RHNA process tends to get a little ugly. Using a number of factors such as jobs, density, transportation, income levels, developable land, the regional planning agencies divide up their regional allocations into city level RHNA allocations (pdf). The regional planning agencies do not evaluate whether there is a sufficient water supply available to support housing requirements when they impose the allocations on the cities or communities. This is where the disconnect, intentional or not begins.

Some cities like Los Angeles accept these housing allocations with reckless abandon and run with it while other cities like Irvine, Palmdale, La Mirada and Pleasanton have tried unsuccessfully to challenge the regional agencies role and RHNA allocations in courts. In Irvine, the city had designated a decommissioned naval base to be the site of the “Orange County Great Park’. However, SCAG saw its potential as a huge housing development and applied a RHNA allocation of 35,660 units to the city. Pleasanton sought to limit growth with caps that were approved by voters but was sued because their housing plan they did not comply with RHNA.

City Level RHNA

The next and final step in the RHNA process is at the city level. Each city after having received their share of RHNA allocations must now incorporate it into a housing plan called the ‘Housing Element’. The Housing Element identifies the locations of all the parcels in the city that are candidates for higher density growth and is one of the eleven 'elements' that goes into a city's 'General Plan'. This is effectively the only place throughout the RHNA process where water supply comes into play, albeit indirectly.

The Housing Element does not evaluate whether there is a sufficient water supply available to support housing requirements. Instead it leaves it up to the water agencies UWMP. In the City of Los Angeles’s Housing Element, it has a section on ‘infrastructure’ where water supply is brought up. Here, the plan cites the 2010 UWMP stating “there is an adequate supply of water to serve the population growth projected through the year 2030, beyond the Housing Element planning period.

Clearly the adequacy of the water supply in Los Angeles is demonstrably untrue, but there is no regulatory oversight anywhere in the RHNA process that will halt a project when there is no water to support it. If the water plan is based on faulty assumptions, the project will glide through to approval making it nearly impossible to create a reliable water supply.

Challenging RHNA is not possible. Courts say they have no jurisdiction. Challenging the water is one of the few areas where housing allocations can be reduced but it’s not part of the regulatory process. In “Show Me the Water Plan (E. Hanak/PPIC)”, the paper states that “planning laws (SB 221 & SB 610) rely largely on citizen enforcement rather than regulatory oversight by the state” and “that citizens can challenge the responsible local agencies in civil suits.”

Challenging water supply has been done from time to time by highly motivated groups of citizens. In “California Water Planning 2009 Vol 4 Reference Guide”(R. Waterman) this study described one such instance when a Santa Clarita group called “Santa Clarita Organization for Planning the Environment” challenged an EIR for a project involving 2,545 homes, a retail center and 42 acres of community facilities. In (SCOPE) v. county of Los Angeles, The judge agreed and the court rejected the EIR stating that the “county’s approval of the West Creek EIR is not supported by substantial evidence (of available water).”

But while its happened from time to time it’s not a process that citizens are familiar with and having citizens challenge thousands of projects a year one by one to enforce SB 221 and SB 610 (the “Show me the Water Laws”) is an undue burden. Furthering the burden, the State has legislation such as SB 1818 that allows cities and developers to squeeze more units into a parcel even when its zoned for lower densities.

Cities are not likely to challenge a developers rights to construct housing if the allocations have not been met. RHNA’s complicated process give developers the legal foundation to build new housing and sue if cities don’t cooperate, even when it is obvious to everyone that there is no water available for the project.

So where’s RHNA going to take us?

RHNA is driving up water demand. The Housing Element is updated every eight years and new RHNA allocations come out for each new refresh so what we see every eight years are just small chunks of the housing allocations which keeps the long term past and future view pretty well hidden.

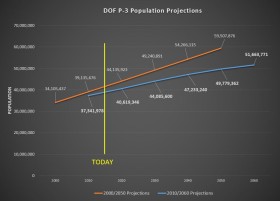
Because RHNA takes its cue from DOF population projections which extend 50 years, if you want to know where RHNA is taking us look no further than the DOF P-3 projections.

These fifty year projections can swing up and down quite a bit. The 2050 projections were reduced 10 million people between the 2006/2014 and 2013/2021 but the damage is already done despite the reduced projection.

L.A.'s last RHNA allocation was 112,876 and it led to a large number of permits being approved though not all of them were necessarily built given the economic crash that occurred in 2008. However, once entitled, they stay entitled. When the economy picks up, the construction can begin. The latest RHNA allocation for Los Angeles dropped to 82,000.

The current DOF projections show the state growing to a population of 51,663,771. With this we can expect the RHNA to increase the density to increase 16% by 2030 and by 32% by 2060. A 32% increase in the City of Los Angeles suggest that water demand would increase over 938,000 Af/y if the city’s demand was held at the current 142 gallons per capita daily. That’s is about 356,000 acre-feet a year over the city’s actual average supply.

But realistically, if the RHNA process continues unrestrained by water supply, the city would have to reduce the demand to 88 gallons per capita daily to meet 2060 population targets. This is not “residential gpcd”, this is the entire city’s demand including commercial, industrial, government and residential! And what's worse.. this is just the City of LA. Imagine how disastrous and frequent droughts will be when the state hits its 16% growth target by 2030 and 32% target by 2060.

California can never have a reliable water supply unless serious reforms are made to RHNA.

(updated on 6/14/2015)

301 Moved Permanently

301 Moved Permanently


nginx/1.18.0 (Ubuntu)