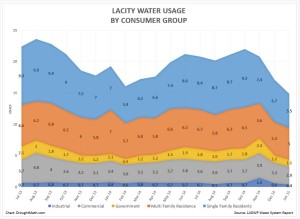
 Note: Spike in Industrial and Governmental for November 2014 was due to LADWP billing issues.
DroughtMath
A Critical look at the City of L.A.'s Water Supply Policy
L.A.’s First Water Plans – The 1985 & 1990 UWMP
Published April 4, 2015 / by dcoffin / Leave a Comment The Urban Water Management Plan (UWMP) is rich in information as it identifies the agencies sources of water (aqueduct, groundwater, imported), amounts of water available from these sources, methods of conveyance, current and future water uses, projected demand, current and future conservation methods, demographics, population density and growth, housing mix, commercial/industrial/governmental demand, etc.
The importance of the UWMP is that it is used as a guideline for making public decisions concerning water and is cited in planning documents, water supply assessments. But the UWMP can also be seriously misused when 'paper water' is inserted into the plans which provides a misleading assessment of the water supply or when city officials simply rubber stamp the findings without any sort of reassessment given current water supply availability.
The City of L.A.'s UWMP's are both fascinating and disappointing in that they paint a picture of great expectations, a long term failure to meet demand and worse, a misleading assessment of the city's true water supply. What follows is a retrospective look back at previous UWMP's. What we find is a blueprint to a permanent water deficit.
The 1985 UWMP - L.A.'s First Water Plan
LA Aqueduct on Google Earth
Published April 1, 2015 / by dcoffin / 5 Comments on LA Aqueduct on Google Earth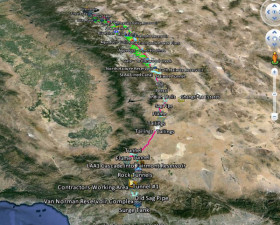 For those of you interested in seeing the LA Aqueduct up close on Google Earth. Download the LA Aqueduct KML in the library on the right and open it in Google Earth.
This a pared down version of my more complete KML but it still has a lot of stuff to explore. Over the next few weeks I'll upload my other KML's including the Colorado River Aqueduct, SWP, Hetch Hetchy, Mokelumne, San Diego aqueducts, etc.
L.A.’s Losing Access to Water
Published April 1, 2015 / by dcoffin / Leave a CommentThis is Part II of a series describing L.A.’s water supply problems and the policies that produced it.
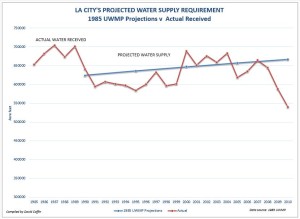
As remarkable as L.A.'s water supply growth was in its first 75 years, city's residents would be stunned by the loss of supply since 1985 if they were aware of it. For awhile optimism crept into the water plans and the city thought that there was no limits to growing since it could continue to rely on its appropriative rights and relatively constant 1984 levels for future growth. In 1984 the city's supply reached 716,915 af with the Los Angeles Aqueduct supplying 74% of the total supply and there really wasn't any reason to believe that it couldn't continue to maintain these levels far into the future.
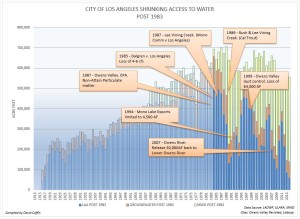
However things began to unravel in a big way. While the city would continue to supply water ranging from 650,000 to 701,000 af/y for the next few years, this was coming as aqueduct levels were falling dramatically and the city was increasingly relying on Metropolitan Water District supply.
L.A. would soon be learning that water in California is a zero sum game and where there are winners, there are always losers. For the first 75 years L.A. was the winner and the people of the Owens and Mono Basins were the losers. Outside of a few episodes of farmers and towns people dynamiting sections of the aqueduct in the early years, exports to L.A. were relatively low key until the Second Los Angeles Aqueduct came in to service. The modest 300,000 af/y imports through the first aqueduct might have continued to this day had the second aqueduct not been built. But in 1971, the second barrel changed all that and it took export levels to an entirely new level.
In three short years the flows through the aqueduct increased 73 percent from 343,767 af to 471,304 af. Exports from Mono, once restricted to 123 cfs by the capacity of the First aqueduct downstream, could now export waters from Rush and Lee Vining Creeks at its full 400 cfs capacity. By 1979 the aqueduct system was delivering over 500,000 af/y using both barrels to Los Angeles.
But the Second aqueduct upset a delicate balance. Entire creek flows on Rush and Lee Vining were diverted. Little water was passing by the diversion gates into the lower creeks and into Mono Lake. The creeks dried up and so was Mono Lake. Similarly 120 miles south, groundwater levels in the Owens Basin was falling dramatically and unable to support native plants and turning the basin into the most dust polluted region in the United States.
Once unnoticed, now people were taking notice. For the first time, L.A.’s aqueducts imports were threatening the health of areas where the waters came from. It was one thing to take water away from farmers or local townspeople. The city argued, they sold their rights fair and square. However it was an entirely different matter, to destroy creeks, rivers, lakes and produce dangerous levels of dust. The lawsuits began to fly and the courts found another rights was in peril, the ‘public trust’. Public trust and CEQA would trump the city’s ‘appropriative right’ and what followed would bring aqueduct exports back to 1940's levels. But the damage was already done.
L.A.’s first bow shock came in 1972 when the County of Inyo filed suit under the California Environmental Quality Act. The court of appeals later limited the city's pumping to 148 cu ft/sec thus losing about 107,000 af/y. In 1983 'Public Trust' mandated reconsideration of LADWP creek diversions and diversions on Mono Lake.
Los Angeles began losing access to water. The magnitude of the loses were huge. Today, 60% of the city's aqueduct supply is devoted to mitigating the environmental damage that the Second Aqueduct started. What follows is a summary of the actions that resulted in the city's loss of access to water.
Mono Basin Litigations
- 1983 (Audubon v Superior Court) ‘Public trust’ mandated reconsideration of LADWP diversions and the diversions on Mono Lake.
- 1985 (Dalgren v Los Angeles) – Court finds ‘public trust’ requires release of 19 cfs down Rush Creek to protect fisheries.
- 1987 – (Mono Lake Committee v City of Los Angeles) Court finds ‘public trust’ requires release of 4-5 cfs down Lee Vining Creek to protect fish habitat.
- 1989 (California Trout v SWRCB; Caltrout I) – State Water Resource Control Board was in violation of Fish and Game Code by failing to establish ‘bypass requirements’ at LADWP diversion in Mono Basin.
- 1990 (California Trout v Superior Court; Caltrout II) – Court directed SWRCB to exercise it duty to amend LADWP Mono stream water rights to release sufficient water to re-establish and maintain fisheries that existed before the diversions.
These cases were coordinated (packaged as one) as ‘Mono Lake Water Right Cases’ in El Dorado Superior Court. The net result of this collection of cases was that the court ordered LADWP to release 60,000AF of water down Mono Lake tributaries. In 1991 the same court found that 60,000AF was not sufficient to maintain Mono Lake levels and set permanent stream flows limiting exports from Mono Basin to 4,500AF per year to raise and maintain level of Mono Lake to 6,377 ft above sea level.
Loss: > 60,000AF
Owens Basin Litigation
- 1973 – County of Inyo v. Yorty, California environmental Quality Act applies to Owens Valley pumping.
- 1973-1984 Groundwater is restricted to 149 cfs.
- 1987 – EPA finds Owens Valley in ‘non-attainment of particulate (dust) matter.
- 1999 – (Great Basin Air Pollution Control District v. Los Angeles) - To meet PM-10 standards, LADWP to divert ~90,000 AF to Owens Lake to control dust.
- 2007 – Lower Owens River Project (LORP) A written understanding between Inyo County, California Department of Fish and Game, the State Lands Commission, the Sierra Club, the Owens Valley Committee and the LADWP to release 40 cfs (30,000AF) into Lower Owens River to mitigate pumping in the Owens Valley.
Loss: > 90,000AF
Metropolitan Water District
The City of Los Angeles isn't the only client agency of the MWD. The MWD serves 25 other agencies representing all of Southern California. Since 1984 the city has increasingly lost access to aqueduct water and depended more on the MWD. Whereas 74% of the city's supply came from the aqueduct in 1984, today the MWD supplies the city with ~75 percent of its water.
However growth, the drought and environmental litigation have taken a toll on the MWD as well. Allocations from the State Water Project allocations were drastically curtailed in 2007 with a federal court decision to reduce pumping. Over the last five years have been reduced to just 39% and in the last two years to just 13%. Metropolitan states that with just 930,000 af of Colorado River deliveries and 382,000 af of SWP water, it will be forced to make significant withdrawals from the Southland’s remaining reserves to help meet water demands. Metropolitan's reserves have fallen to 50% of what they were in 2012.
In October of 2014, Mayor Eric Garcetti issued an executive order to reduce the city's reliance on MWD water by 50%. While he did not state it I don't think there should be much doubt that the city's decision to reduce MWD purchases is related to MWD's own supply challenges.
Loss: > 200,000AF
![]()
Recommended reading: ‘Owens Valley Revisited’ (2007) by Gary D. Libecap which focuses on the original negotiations between the Eaton, the city and Owens Valley farmers between 1905 and 1938 and the environmental litigations that took place from 1983 to the present.
L.A.’s Growing Access to Water
Published March 29, 2015 / by dcoffin / Leave a Comment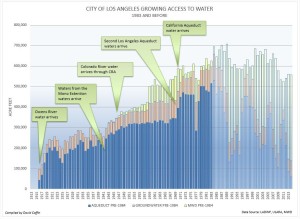
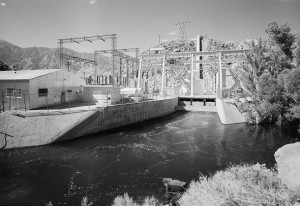
Library of Congress HAER CA-298-K-6
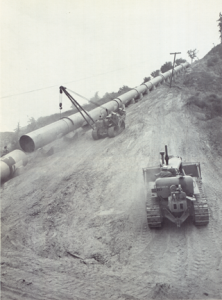
at Terminal Hill.
Los Angeles Aqueduct Monthly Supply 12/14
Published March 28, 2015 / by dcoffin / Leave a Comment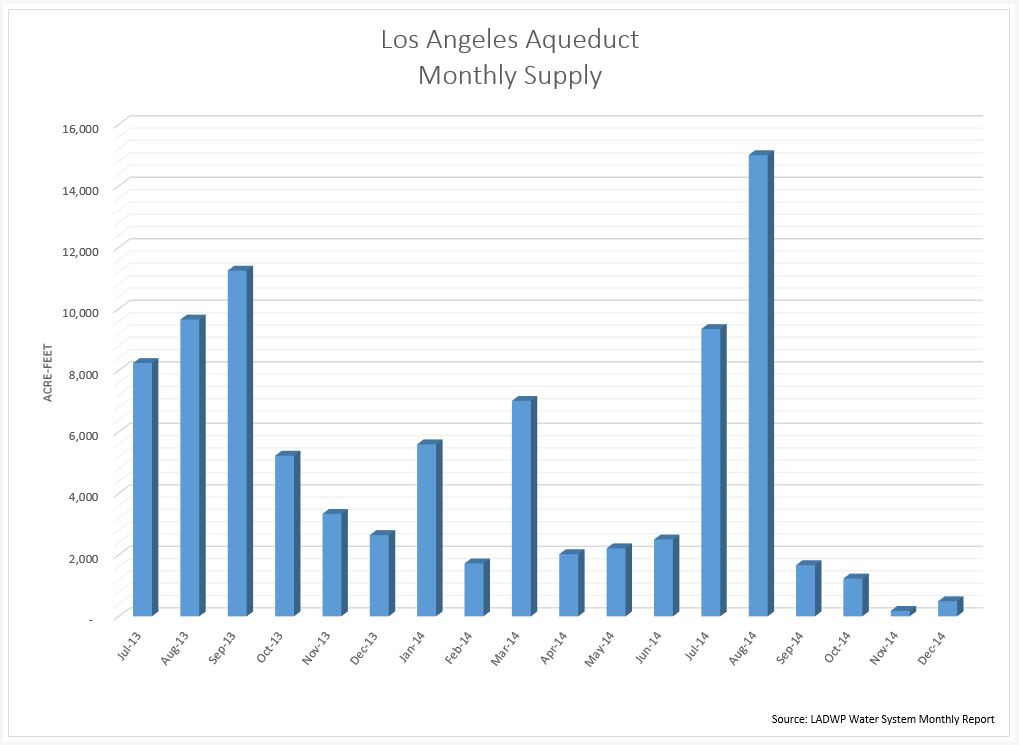 The good news perhaps is that the December LADWP reports that city-wide overall water use was 24.3 lower than the base year and 16.7 percent lower than the prior year.