With the close of the 2015 water year last September, it's time to step back and take a look at how well the LADWP met its first five year projections that came from the 2010 Urban Water Management Plan. EIR's winding their way through the planning department use this data to presumably assure us that there will be sufficient water supply in 5, 10, 15, and 20 years into the future.
So how did the 2010 UWMP fare in its first five years? Did the department meet their total supply projections? Did they meet the groundwater, recycle, transfers and stormwater projections? What does this mean for the new 2015 UWMP that is being drafted today and soon be released for public comment?
Let's take a look and compare this years water deliveries to the last two UWMP's.
- A Look at the Total Supply
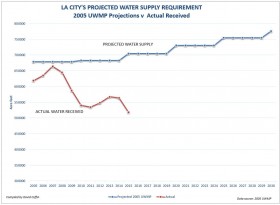
The following two charts show us the total supply entering the LADWP water supply system which includes all of the categories mentioned above.
 |
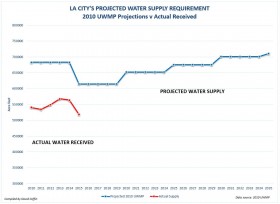 |
It's not pretty. In both charts we find that the department has not been meeting the supply projections that EIR's routinely cite in the planning documents assuring the city of sufficient supplies. Supply levels are far below both the 2005 and 2010 UWMP projections and trending down. The failure to meet these projections while planning departments continue to green-light projects contributes heavily to the city's water shortage.
The next sections will tell us where the department is falling short in the city's water supply portfolio.
- Source: Aqueduct
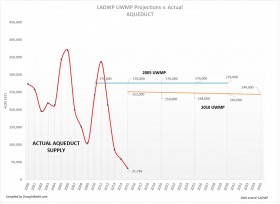
Having already been battered in 2013 and 2014, its hard to imagine the Los Angeles Aqueduct deliveries getting worse but it did. 2015 turned out far worse for the aqueduct as it's deliveries fell to a mere 31,766 AF for the entire year. As a point of reference, 25,000 AF would normally be considered an 'average month' prior to 2000.
The city's aqueduct is the largest city owned contributor to the city's water supply portfolio but in April, May and June it fell behind even recycled water! EIR's circulating through the city's planning department assured planners that by 2015 the city would be receiving 252,000 AF of aqueduct water each year.
 |
 |
Clearly the weather pattern over the Eastern Sierras in the last three years has had an effect on the aqueduct supply as it has averaged just 58,000 AF/y, but even if the department had maintained the 2000-2012 average supply levels, it would still be below the departments long term projections.
Aqueduct Grade: F
- Source: Groundwater
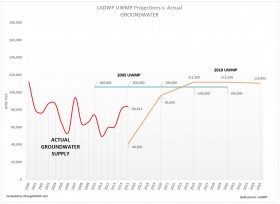
Groundwater is the city's second largest city owned contributor to the water supply portfolio. After decades of consistently missing supply projections and losing what credibility it could have earned, the LADWP was forced to lower its projections by reducing it's groundwater projections by 62 percent. Having done that, for the first time in 16 years the department actually came out ahead in 2015.
But we can't get too excited. The department's average production since 2000 was just 74,000 acre feet per year which is far less than the assurances found in EIR's stating that the LADWP will produce an average yield of 96,000 acre feet per year by 2020 and climb to over 110,000 AF/y. Groundwater production is not a reliably consistent year-to-year source of supply when pumping exceeds the San Fernando basin's average recharge rate. One or more years of heavy pumping have to be followed by several years of reduced pumping to allow for the basin to recharge.
Groundwater Supply Grade: D
- Source: Recycle
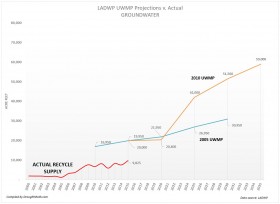
While the LADWP projected gains for recycled water in the ten's of thousands of acre-feet, it's success over the past two decades could only be measured in the hundreds of acre-feet. EIR's circulating through the city's planning department over the last five years assured planners that by 2015, recycled water would be contributing 20,000 acre-feet per year to the city's portfolio. However, the department didn't even come close with just ~9,800 AF entering the system. This year we found that the missed its 2010 UWMP 5 year milestone by over 50 percent.
 |
 |
Past UWMP's regularly projected that the department would produce over 30,000 AF/y and the latest 2010 plan raised this further promising planners 59,000 Af/y by 2035. The chance of this happening is as remote as seeing the department replace all its aging water mains by 2035.
The Department of Water Resources says that if utilities can't access water they say they have access to, this is called paper water.
Recycled Water Grade: D
- Source: Transfers
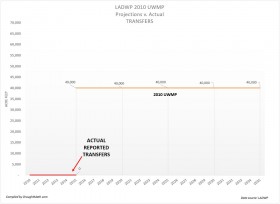
EIR's circulating through the city's planning department assured planners that by 2015, water transfers of 40,000 acre feet each year would be contributing to the city's supply portfolio. The department constructed the $40 million Neenach Pumping Station Turnout Facility Project in the Antelope Valley to facilitate transfers of water from the Central Valley and Northern California but no sellers were found, no contracts were signed and the promised 40,000 AF never entered the system.
'Transfers' are sales of water rights between one entity to another. To effect a transfer the city would have to find willing sellers such as water agencies or farms with surplus water and sign contracts for 40,000 AF/y of water.
LADWP's Transfers certainly falls under the definition of paper water.
Interestingly, LADWP's entry into the water market puts it in direct competition with its main provider of imported water, the Metropolitan Water District.
Transfers - Grade: F
- Storm Water Capture
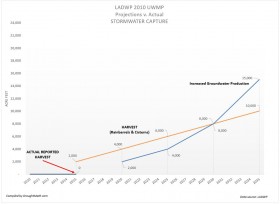
Storm Water Capture is composed of two subcategories of water, Harvesting (Rain Barrels & Cisterns) and 'Increased Groundwater Production'. Of the two, that later is not scheduled to produce water until 2020.
Since the department created this category of water, EIR's have been assuring city planners that Harvesting will reduce the city's demand by 2,000 AF by 2015.
The problem with this category of water is that it never enters the city's water system and thus cannot be certifiably measured. This creates doubt to whether the 2,000 acre feet per year is real water or just paper water. When LADWP managers were questioned about this they admitted that they do not have the ability to physically measure this water and would instead rely solely on models.
I have serious doubts that models could withstand a legal test in courts if an EIR were challenged because there is no way of knowing how many of the rain barrels were distributed, how many are actually being used or repurposed and how much water they actually captured. Furthermore, it would take 11 million rain barrels to store 2,000 AF of water that roughly amounts to 27 rain barrels per single family household.
I firmly place Harvesting in the category of paper water.
Harvesting - Grade: F
 |
 |
- Source: Conservation
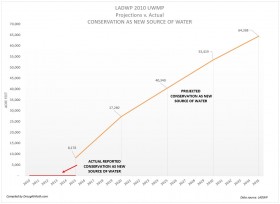
EIR's circulating through the city's planning department assured planners that by 2015, the city would be receiving 8,178 acre feet of water per year categorized as Conservation. However, Conservation is not a source. Water supply entering the city water system cannot be counted twice. New water comes into the city system as groundwater, recycled water, or imported water through the aqueduct and MWD.
When residents make a concerted effort to conserve and the resulting savings is redirected elsewhere, this doesn’t add to the supply, it merely stretches out the supply or allows it to be re-allocated to other uses such as new construction. Double-dipping is not a legal accounting method.
If the LADWP wants to demonstrate to the public how much the savings is made by conserving, it needs to put this on the demand side of the equation by reducing the gallons per capita daily. Until then this is just another form of paper water.
Conservation - Grade: No grade. Not a supply
- Summary
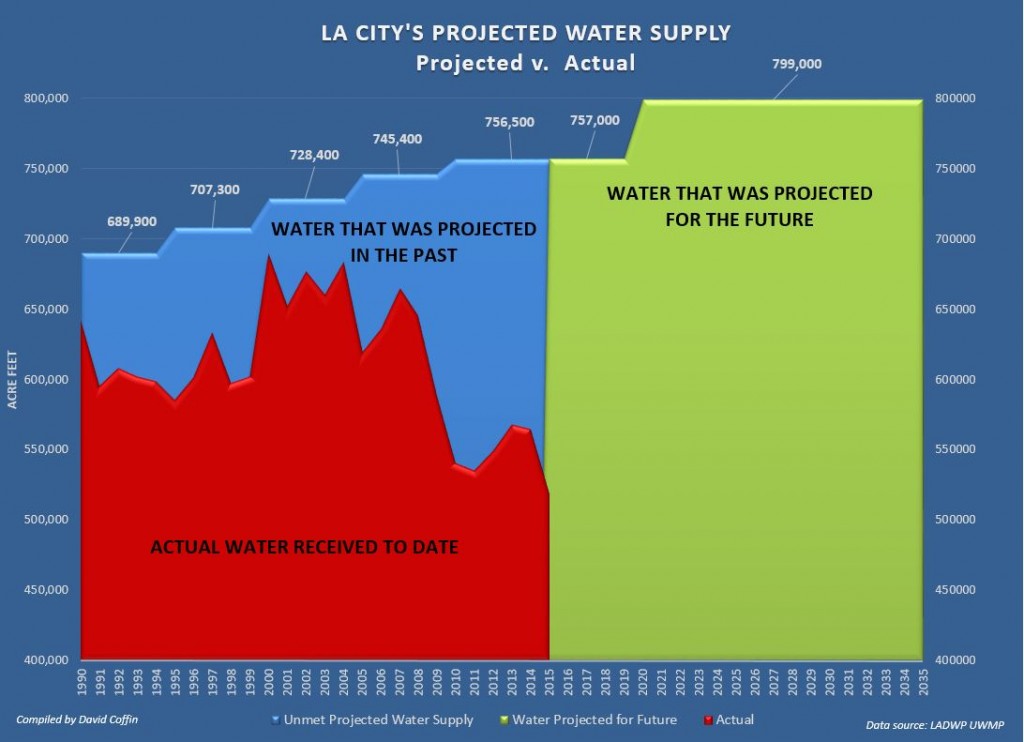
Given how important it is to meet the assurances that planning documents such as Environmental Impact Reports cite, we would have to assign an 'F' grade to the LADWP for failing to meet its own water supply projections.
One might think today that the city's shortage is just a recent phenomena, it isn't. Here is what the LADWP's updated record looks like going back to 1990.
Meeting Supplies cited in EIR's - Grade: F
