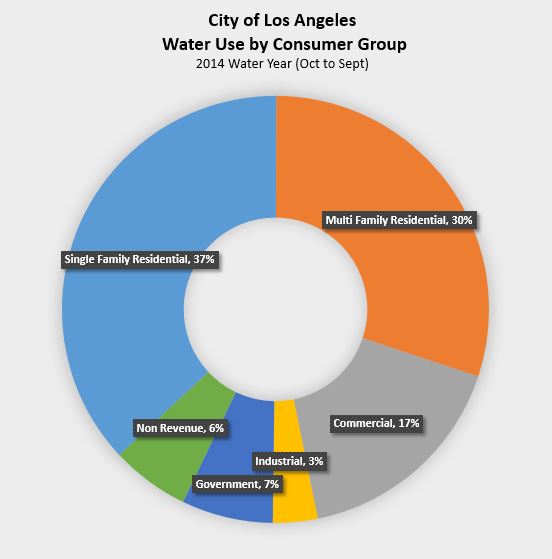
In another earlier post we saw ‘how much’ water each consumer group in the City of Los Angeles used. Here is a comparative look at where the water goes by percentage.
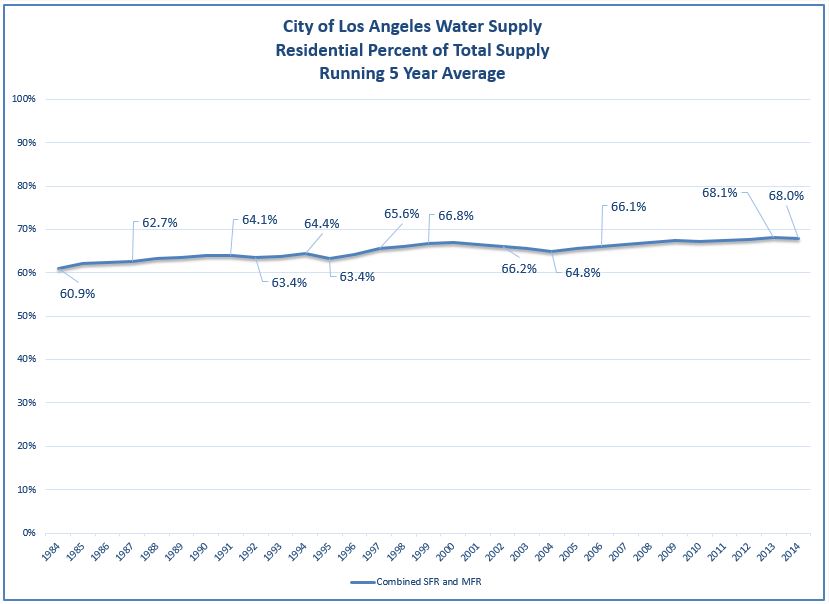
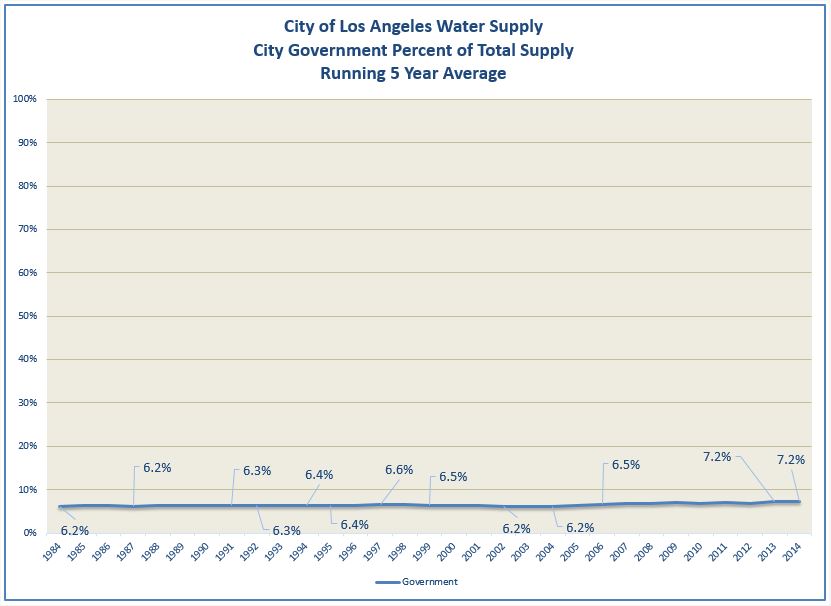
Next we see both where the growth or reductions in share are between 1984 and 2014.
  |
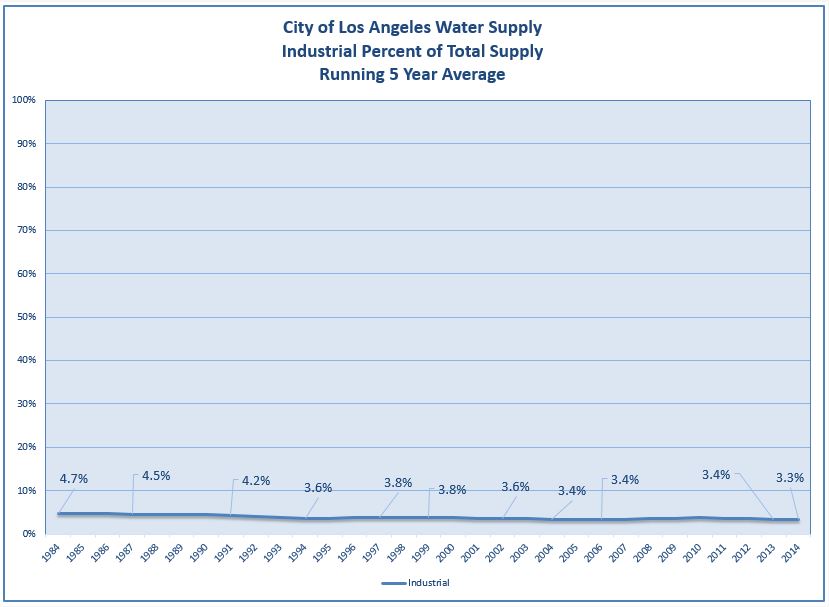 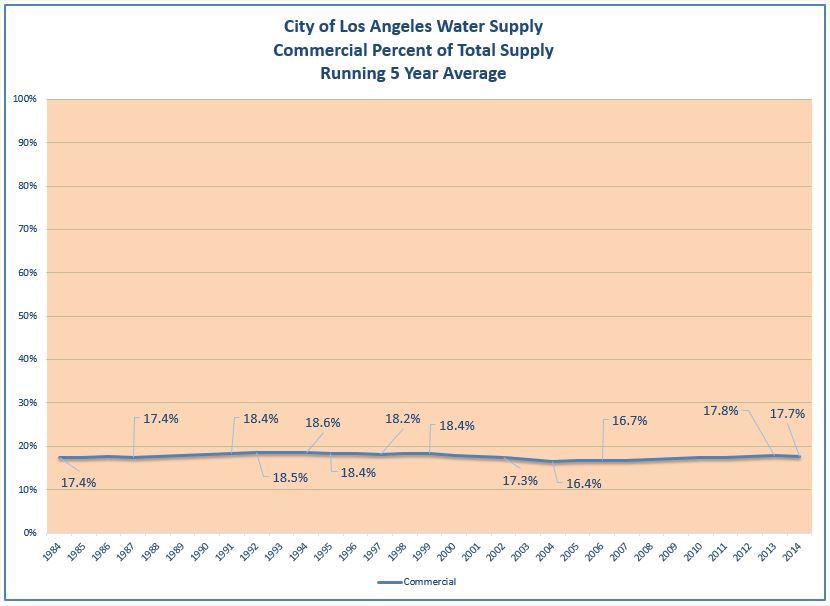 |
Residential share increased from 60.9% to 68% (12 percent change). Commercial was relatively flat at .3 percent from 17.4% to 17.7%. Industrial share fell from 4.7% to 3.3% (30 percent loss) of total supply while City Government increased from 6.2% to 7.2% (16 percent change) of total supply.
What does non-revenue refer to?
Non revenue water is the difference between the supply (LAA, MWD, GroundWater, and Recycle) and demand (SFR, MFR, Commercial, Industrial, and Government). When supply exceeds demand the extra water is stored and classed as non-revenue. When demand exceeds supply, the water is pulled from storage and put into the system and becomes revenue. In the 2014 water year, demand exceeded supply 10 out of 12 months.