In 1983 the State of California passed the Urban Water Management Plan Act that required water suppliers to provide a water plan every five years.
The Urban Water Management Plan (UWMP) is rich in information as it identifies the agencies sources of water (aqueduct, groundwater, imported), amounts of water available from these sources, methods of conveyance, current and future water uses, projected demand, current and future conservation methods, demographics, population density and growth, housing mix, commercial/industrial/governmental demand, etc.
The importance of the UWMP is that it is used as a guideline for making public decisions concerning water and is cited in planning documents, water supply assessments. But the UWMP can also be seriously misused when 'paper water' is inserted into the plans which provides a misleading assessment of the water supply or when city officials simply rubber stamp the findings without any sort of reassessment given current water supply availability.
The City of L.A.'s UWMP's are both fascinating and disappointing in that they paint a picture of great expectations, a long term failure to meet demand and worse, a misleading assessment of the city's true water supply. What follows is a retrospective look back at previous UWMP's. What we find is a blueprint to a permanent water deficit.
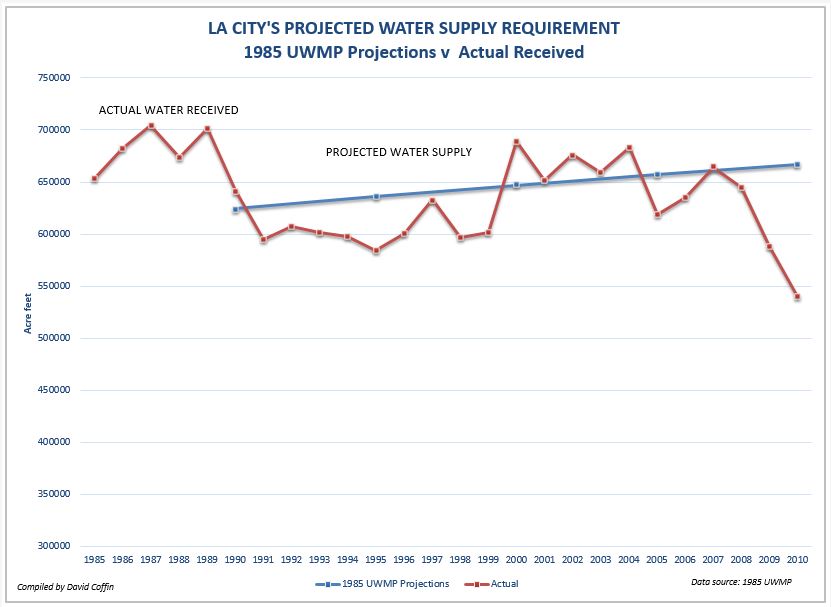
The 1985 UWMP - L.A.'s First Water PlanFigure 1
The 1985 UWMP was the first state mandated water plan published by LADWP. This first time report was an honest and useful assessment of the city's water supply at the time. The plan assumed the city would receive a constant 470,000 Af/y supply through the Los Angeles aqueduct, 103,000 Af/y of groundwater and a small but growing reliance on MWD water between 1986 through 2010.
From a planning perspective the most important part of the UWMP are the tables that show the projected water requirements at 5, 10, 15, and 20 increments for average years. The tables break down how much water the city assumes it will receive through the aqueduct, local groundwater, MWD, and recycled water. It's important that these projections meet the actual supply 5, 10, 15, and 20 years later because they are used in environmental impact reports and water supply assessments as guidelines for future development. If the actual supply doesn't meet the projections then we can assume we are creating a water supply deficit.
The charts shown to the right are based on these tables. In figure 1 we see that the actual supply (red) had closely matched the 1985 UWMP projections (blue) up until 2008.
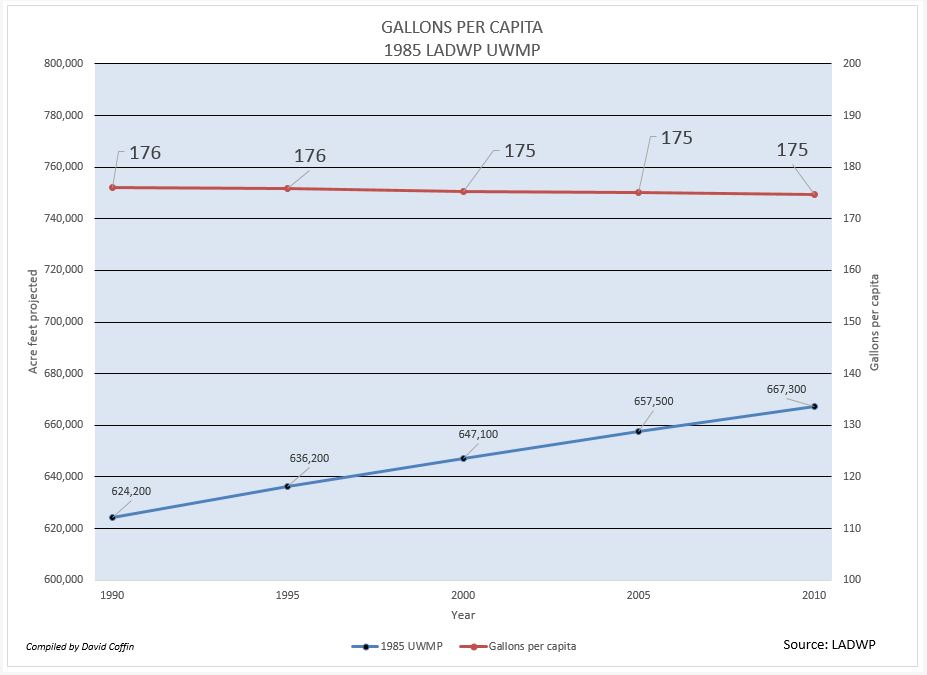
Figure 2
The UWMP roughly bases its projections on the current gallons per capita per day (GPCD) supply and future population estimates that are provided by the Southern California Association of Governments or also known as SCAG.
In figure 2 we find that the 1985 water supply projections for the period between 1990 and 2010 were based on a 176 to 175 gallons per capita day (red) using the projected population from 3.16 million people to 3.41 million during this period.
By sticking to this formula the department chose a relatively flat supply of water that would grow from 624,200 acre-feet of water in 1990 to 667,300 af in 2010. This seemed to be a fairly reasoned position to take given there was significant ongoing environmental litigation between 1973 and 1984 and the city's was required to reduce groundwater pumping in the Owens Valley to 149 cfs as mentioned in the previous article L.A.'s Losing Access to Water.
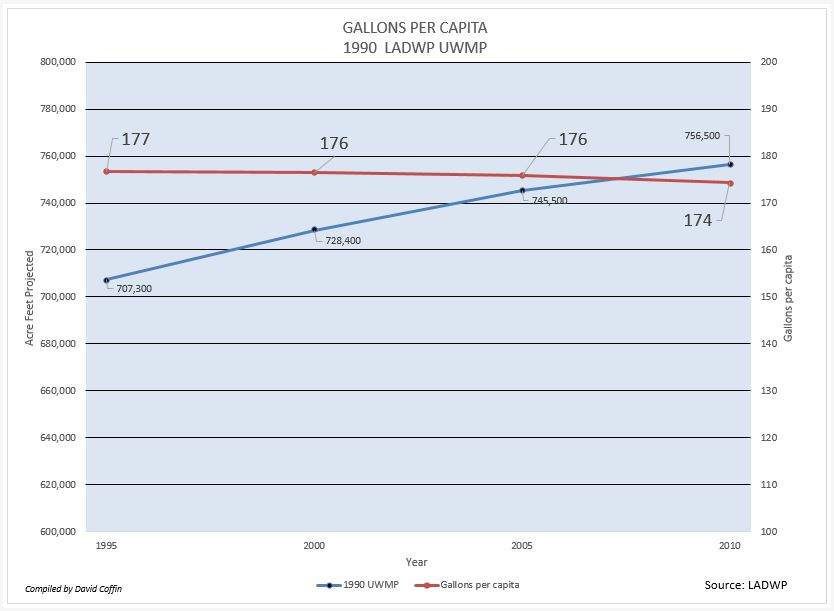
The 1990 UWMP - L.A.'s Second Water PlanFigure 3
In 1990 however things began to change. The city's population exceeded the projections cited in the 1985 UWMP by 10 percent. The 3,166,000 projected population in the 1985 report turned out to be 10 percent higher at 3,485,398.
To meet that water demand and updated population estimates, the department chose to raise the gallons per capita to 177 gallons per day (figure 3) believing that supplies would grow significantly over the next twenty years.
However this effectively raised its supply projection to 707,300 af/y which was far higher than the 636,200 af cited in the 1985 UWMP. They chose to do this in spite of the fact that the aqueduct supplies had fallen from 463,044 af to 321,775 af and that the actual total supply had fallen (figure 4) from 641,545 af to 584,727 af since the first report. A 56,818 af drop. To offset this much of this drop and thus support the higher level of supply the DWP would have to leverage the numbers using paper water in the groundwater and recycled water projections (figure 5 & 6) as well as increase it dependence on MWD water by 400%.
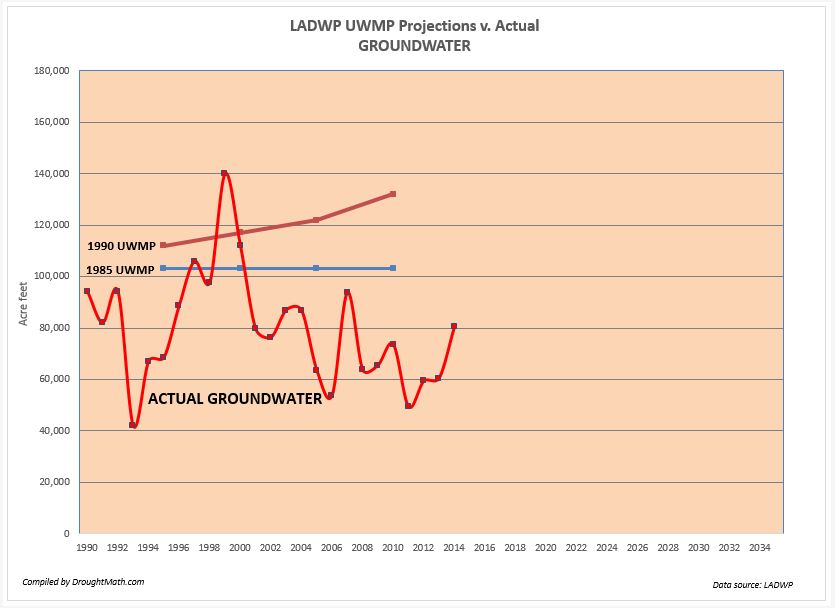
Figure 4
Surprisingly, given the loss of access to waters due to ongoing environmental litigations (Dalgren v. Los Angeles 1985, Cal Trout v. SWRCB 1989 & halting of Mono Lake exports 1987-1989) the department seemed to be doubling down on its belief that it would be able to increase the city's supply in each succeeding 5 year targets to eventually supply 756,500 af by the year 2010. The difference the report cited would made up for by an increasing reliance on MWD water growing from 61 af/y to 205 af/y over the next 15 years.
By the end of this report's effectivity however, the city would be forced to lower some of its expectations but hold firm on others.
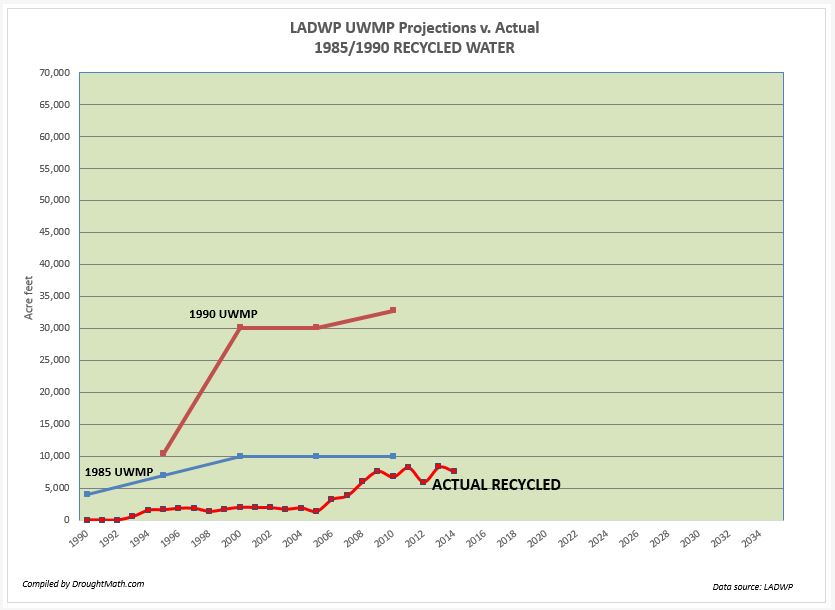
Fig 5. Groundwater ProjectionsFig 6. Recycled Water projections
Next: The 1995 to 2000 UWMP's
 The Urban Water Management Plan (UWMP) is rich in information as it identifies the agencies sources of water (aqueduct, groundwater, imported), amounts of water available from these sources, methods of conveyance, current and future water uses, projected demand, current and future conservation methods, demographics, population density and growth, housing mix, commercial/industrial/governmental demand, etc.
The importance of the UWMP is that it is used as a guideline for making public decisions concerning water and is cited in planning documents, water supply assessments. But the UWMP can also be seriously misused when 'paper water' is inserted into the plans which provides a misleading assessment of the water supply or when city officials simply rubber stamp the findings without any sort of reassessment given current water supply availability.
The City of L.A.'s UWMP's are both fascinating and disappointing in that they paint a picture of great expectations, a long term failure to meet demand and worse, a misleading assessment of the city's true water supply. What follows is a retrospective look back at previous UWMP's. What we find is a blueprint to a permanent water deficit.
The 1985 UWMP - L.A.'s First Water Plan
The Urban Water Management Plan (UWMP) is rich in information as it identifies the agencies sources of water (aqueduct, groundwater, imported), amounts of water available from these sources, methods of conveyance, current and future water uses, projected demand, current and future conservation methods, demographics, population density and growth, housing mix, commercial/industrial/governmental demand, etc.
The importance of the UWMP is that it is used as a guideline for making public decisions concerning water and is cited in planning documents, water supply assessments. But the UWMP can also be seriously misused when 'paper water' is inserted into the plans which provides a misleading assessment of the water supply or when city officials simply rubber stamp the findings without any sort of reassessment given current water supply availability.
The City of L.A.'s UWMP's are both fascinating and disappointing in that they paint a picture of great expectations, a long term failure to meet demand and worse, a misleading assessment of the city's true water supply. What follows is a retrospective look back at previous UWMP's. What we find is a blueprint to a permanent water deficit.
The 1985 UWMP - L.A.'s First Water Plan