The City of Los Angeles water plans in the past have projected significant amounts of water that later never came. These large sums of water have been used to approve small and large projects going back to 1990.
When projects are reviewed by city planners, the figures cited in the city's water plans are supposed to assure the community that there is sufficient water for the project over the next 20 to 25 years after they are approved and that the project will not pose a burden to the city's water supply during that period.
Over a 24 year period, this missing water would be equivalent to 4.35 million acre feet which is slightly more than a full years worth of California Aqueduct water at full allocation.
L..A's recent drought has been going on far longer than the statewide drought. California's last drought was declared in 2008 and it ended in 2011 then re-declared it in 2014. L.A's drought was declared in 2008 and was never rescinded. So why has L.A.'s drought been so persistent and growing by the day?
The City of Los Angeles has been pretty effective at hiding the problem from the standpoint of planning. And Neighborhood Councils? Forget about it.
Having been to many planning and land use meetings where new projects come up for discussion and a vote, I can't remember any time that water was ever brought up during the question and answer periods except for the times I brought it up like here and here and here.
My experience is that few if any city council members or neighborhood council members know anything about the Urban Water Management Plan, Water Supply Assessments, or SB 610 or 221.
During these meetings the discussion around projects generally revolves around the height of the project, the traffic impacts of the project, traffic studies, and finding ways to mitigate the impact of the additional of 2000 or so vehicle trips that the project will generate daily. From there the are discussions go on to window heights, set-ins, low income units, etc., but not water is never discussed.
All of those these other issues are really quite local (though traffic clearly has a cumulative effect over the region) and most can presumably be mitigated. Help with mitigation its usually provided by a deputy council member or staffer from the councils office who step's in and suggests how these things can be addressed by the city such as adding thirty seconds to a stop light or adding a left turn lane.
What is never talked about is water supply. Water is something that really can't be mitigated anymore since there are no more William Mulholland's and now it has become a zero sum issue. It's easy to see why the city would rather talk about traffic, construction, building height's since people are more familiar with those things and those issues are arguably solvable.
Water on the other hand pulls into the discussion something that is far more regional and can't be mitigated. The city of Los Angeles has a history of saying it has water for these projects when it really doesn't. So they want the issue to stay behind the curtain. Projects usually describe the city's water supply in environmental documents behind statements like this:
A typical project environmental report declares that water is not a problem.
People should be demanding that local planning committees and councilmembers to take water supply more seriously and ask more questions before giving the green light to projects in areas with diminished resources.
One prominent member of the City of Los Angeles's 'paper water' portfolio is recycled water. Like L.A.'s groundwater supply, its Urban Water Management Plans between 1990 and 2005 had projected rapidly growing recycled water supplies that would never be realized.
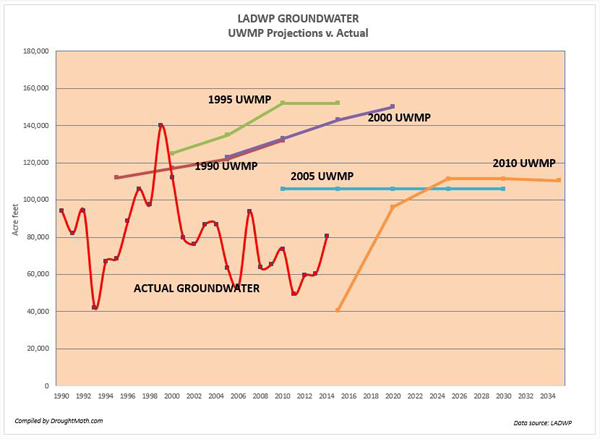
Recycle Water Projections v. Actual Supply
The chart at the right plots the huge gap between the actual recycled water supply the city had access to and the anticipated supplies that each UWMP projected. The gap between the two is the paper water that would be used to as evidence that medium and high density projects going through the planning process would have sufficient water when in fact they didn't.
For example when we look at the 1990 UWMP projections, the city expected that its program for recycle water supply would triple within 5 years and eventually provide the city with over 30,000 af/y in 2000. This never happened.
When the following 1995 UWMP came out it didn't begin where the 1990 plan left off. If fact it would cite less water in 2000 than the '90 plan which suggests that the effort to increase recycled water was making no progress.
Of course paper water being what it is, that plan would still suggest (with no factual basis) that recycled water would still triple, this time within 10 years and then more than quadruple to 38,000 af/y within 15 years.
The next 2000 UWMP was no different, it would also start off with less water than the preceding plans had projected and then nearly quadruple within 15 years with supplies approaching 30,000 af/y.
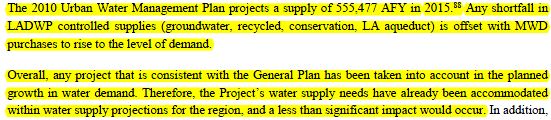
Recycled water supply v. total supplyLittle progress meeting past targets
The actual supply between 1985 and 2010 hasn't been nearly so grand as the city's expectations and glossy presentations that suggested that recycled water would help the city meet its needs. The actual recycle water supply between 1995 and 2005 was so tiny at just 1,748 af/y and was barely perceptible on a chart.
Between 2006 and 2014 the city's recycle supply would grow to just 6,410 af/y which is far below any of the past UWMP projections that ranged from 19,950 af/y to 38,000 af/y and light years behind the projected 850% increase now cited in the 2010 UWMP to 59,000 af/y by 2035.
This huge gap between 'projected or anticipated supply' and 'actual supply' is an unfortunate characteristic of the city's water supply we would call paper water. It's a promise spanning 5 water plans and 25 years that was used to mischaracterize the city's supply to approve high density development.
The gap has only widen between 1990 and 2015 and given the city's history of meeting its projections, I don't have much faith that it will meet the 59,000 af/y target it has set for 2035. If it could have met the much lower targets it had set in earlier plans, it would have done so by now. However the obstacles such as trying to roll out a citywide network of purple pipe were just to huge to overcome.
Now that we find that the City of Los Angeles routinely props up its water portfolio using 'paper water' so where do we find it? We first find evidence of the city's reliance on paper water in the groundwater projections cited in each of the Urban Water Management Plans between 1985 and 2005.
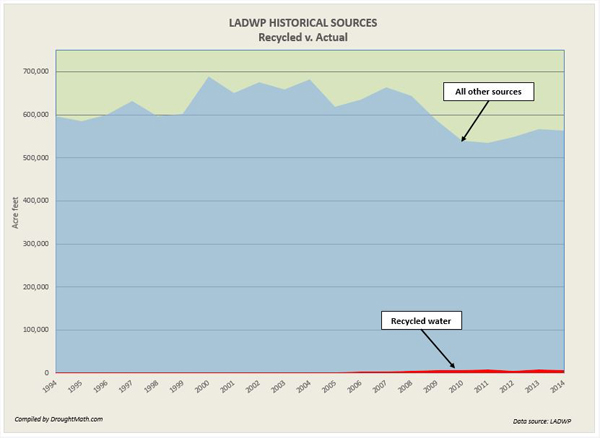
Groundwater supply is just 67% of UWMP projections.
The chart at the right plots the gap between the actual groundwater supply the city had access to and the anticipated supplies that each UWMP projected. The gap between the two is the paper water that would be used to as evidence that medium and high density projects going through the planning process would have sufficient water when in fact they didn’t.
The city routinely projected supplies that ranged from 103,000 AF to 155,000 AF during that period. Including a brief period between 1997 and 2000 of exceptionally high pumping, the actual amount of well water produced by the city was 33% below expectations. Far below the city's expectations and glossy presentations that suggested that growing groundwater supply would help the city meet its needs and allow its growth ambitions.
Despite the city's average of just 71,000 AF since 2001, the city's current 2010 water plan continues propping up it's paper water inventory citing that it should an average of 107,426 af/y in available groundwater supplies between the years 2020 and 2035.
Between 2000 and 2014 the city's groundwater supply would remain flat at 71,059 af/y which is far below any of the past UWMP projections that ranged from 103,000 af/y to as high as 152,000 af/y.
Paper Water
This gap between 'projected or anticipated supply' and 'actual supply' is an unfortunate characteristic of the city's water supply. It's a promise spanning 5 water plans and 25 years that was used to mischaracterize the city's supply to approve high density development.
The City's failure to meet groundwater projections stems primarily from the fact that it is just storage. The City of Los Angeles Stormwater Program reports that the city captures just 27,000 AF of water to recharge the underground storage. The reason for this can be found in Upper Los Angeles River Area Watermaster reports which state that "The continued growth of residential, commercial, and industrial developments has required that more water be imported to supplement the local groundwater supplies in ULARA over time. Imported supplies to ULARA are from the Los Angeles Aqueduct and from MWD".
Because of the extent of development in the valley, much of today's potential groundwater supply is simply channeled into storm drains and down the LA River. Secondly, ULARA reports that many of the San Fernando Valleys groundwater pumps have been taken out of service due to groundwater contamination.
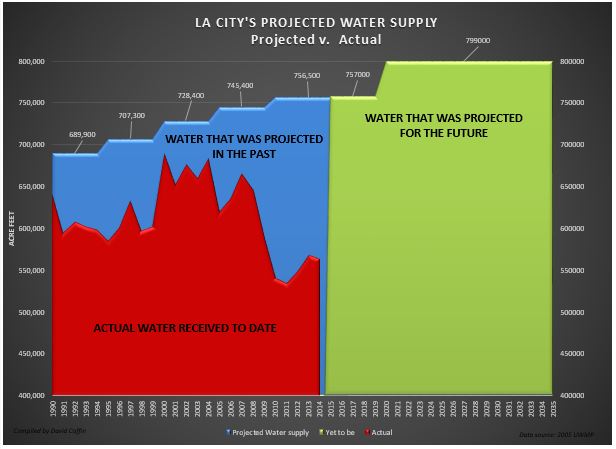
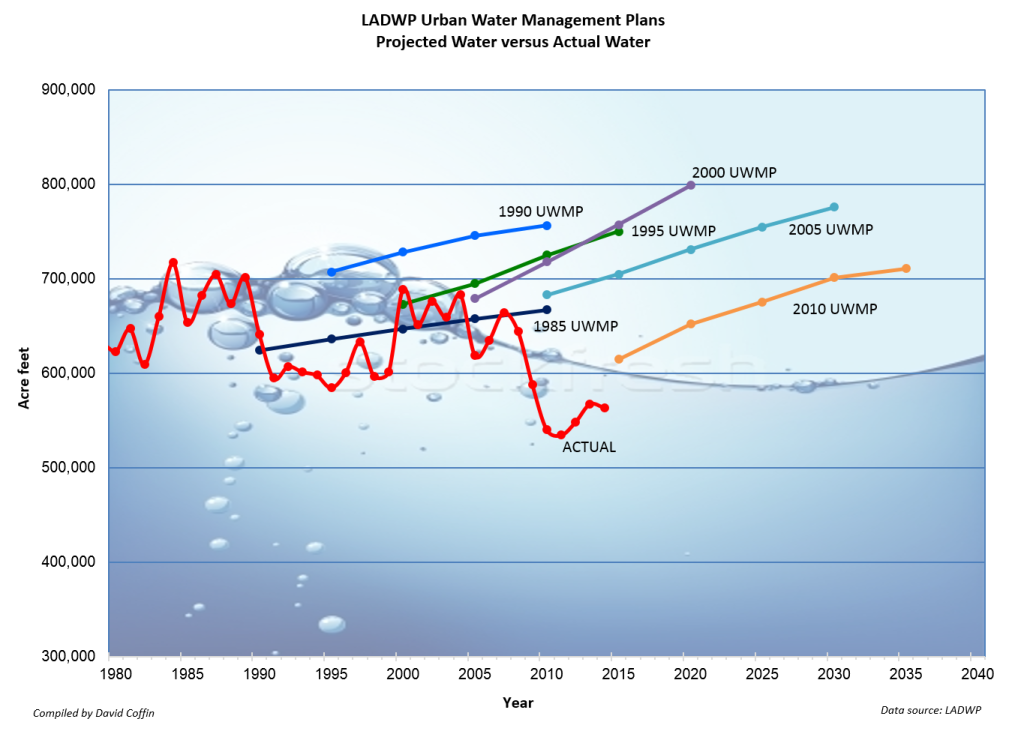
This graph shows the City of Los Angeles's history of 'paper water' since 1990 and the actual amount of water it has been able to obtain. Paper water is the gap between what the city anticipated it would need for it future growth versus the amount of water it actually received. The projections appear in the city's Urban Water Management Plan (UWMP) which is published and approved by the city council every five years.
The city uses paper water along with real water to demonstrate that it has sufficient water supplies for the thousands of medium and high density projects going through the planning process. As time goes by however the city has not been able to access that water which has created a severe deficit resulting in a drought. Despite not having access to this water, each new water plan continues to anticipate levels of water supplies that it clearly has no access to.
Residents caught in the middle of this vicious drought/growth cycle and have been forced pay for this policy with higher utility prices, enforcement actions, and lower property values.
Chart showing the gap between actual supply the city receives and anticipated supply projected in each UWMP.
Part IV in a series describing L.A.’s water supply problems, the drought and the policies that produced it.L.A.'s PAPER WATER
Urban Water Management Plans of 1990, 1995, 2000, & 2005 had all projected huge demand requirements and provided us with solutions on how it would met. However, as each superseding UWMP was approved, it left behind a growing legacy of plans with a history of projections that were never met. Over time, it became apparent that this is not simply a miscalculation but likely an intentional effort by the city to mislead the public using ‘paper water’.
Paper water is water that utilities claim they have access to, but is difficult or impossible to access for various reasons. You can't drink paper water or cook with it but you can make lots of promises with it.
The 2009 California Water Plan Update describes such a scenario in an article titled Water for Growth (E. Hanak/PPIC) stating that "A majority of utilities reported considerable normal-year surpluses, both now and 20 years hence, raising the possibility that many are banking on “paper water” for their margin of comfort."
Generally the City of Los Angeles hides its supply shortage behind promises of water that it could never actually deliver on such as groundwater, recycled water and LA Aqueduct water.
Large Projects
One very typical example where paper water was cited would be the massive Playa Vista development that was approved in the early 2000's. The project's water demand which was based on the 2000 UWMP stated:
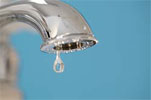
"LADWP anticipates annual water demand within the Department’s service area to increase by 2010 to between 718,000 AF (in a normal year) and 761,000 AF (in a dry year), which represents a demand increase of 5.7 percent to 12.1 percent, respectively, between 2002 and 2010.Fig 1 - Projected Supply v. Actual SupplyThis increased demand in water use is accounted for in LADWP’s Final Year 2000 Urban Water Management Plan Update, and LADWP has identified various means and options for securing adequate water supplies to meet the needs anticipated for 2010, as well as through the year 2020. Ref: EIR No. ENV-2002-6129-EIR"
However the anticipated annual supply of 718,000 AF never materialized by 2010 nor did the 757,000 AF promised by 2015 as shown in Figure 1 at the right.
In 2010 the city water supply was 25% below the projection cited in the Playa Vista EIR at just 540,229 AF and it fell even further behind by 2015. The average yearly supply of 617,645 af/y between 2000 and 2014 was 23% below the projections 2015 projection. Neither aqueduct water, groundwater or recycled water projections were met.
The promise of up to 799,000 af/y of water cited in this EIR is what we would call ‘paper water’. It's this promise of water that contributed to the approval of the project but it was water that can never be had.
Fig 2 - The 2000 UWMP's Paper Water
This particular development is not an isolated situation. Literally every project in the city that has been approved since 1990 cites the inaccessible water in the city's UWMP. Prior and subsequent UWMP's also projected supply levels that could not be achieved. The 2005 water plan cited 705,000 AF this year and up to 776,000 AF by 2030. Even the current 2010 UWMP has similarly projected supplies in excess of 710,000 AF by 2035.
The City of Los Angeles has not been able to produce water supplies in excess of 690,000 AF since 1989.
Smaller Projects Benefit by Paper Water
Large projects with 500 units or more are required by SB-221 to obtain written verification that long term water supply is available for the project. This written verification goes into a tedious analysis of the projects demand and then always comes to the conclusion based on the UWMP's paper water that "adequate water supplies would be available to meet the estimated water demands of the proposed developments..."
The thousands of smaller projects with 499 units or less that are winding their way through the planning process are exempt from this formality. They need only cite the current UWMP which includes all existing and planned future uses of the city's water supply then come to the same conclusion that "that adequate water supplies would be available to meet the estimated water demands of the proposed developments..."
To date, literally every project approved since 1990, both small and large projects alike have been the beneficiary of paper water but it hasn't benefited residents.
Paper Water may be Political Cover
The city's most recent 2010 UWMP greatly lowered projections but that had not stopped or slowed down the approvals of large or small projects alike. The reason why could be found in a statement made by the DWP back in 1990 saying that approving projects is ultimately a "political decision to be decided by the Mayor and the City Council". So it's likely that the water departments insistence on such large water supply projections year after year is to provide political cover to for approving all of the developments making their way through the planning process.
In the 2009 California Water Update, the article Water For Growth alludes to that by noting "...even in jurisdictions with municipal water departments, elected officials may take a shorter-term view of resource adequacy than area residents do. If—as is often asserted—land-use authorities are aligned with predevelopment forces, they may be inclined to favor growth, even if it means higher costs (or a loss in property values) to the community down the road."
The amount of water that agriculture and urban cities use is so huge just trying to quantify it in a meaningful way would be nearly impossible if we had to express it in a unit of measurement that we are familiar with.. the gallon.
For instance, if it was reported that the City of Los Angeles water supply had fallen from 203,656,875,000 gallons to 192,252,090,000 gallons that would be a mouthful and pretty difficult for the reader to immediately comprehend in a comparative sense.
So to tame down the numbers a little, water departments express it in acre-feet or the amount of water in gallons that it would take to fill a container that is one acre square and 1 foot deep. 1 acre-foot is equal to 325,851 of gallons so we could now report that LA's water supply had fallen from 625,000 Af to 590,000 Af which is a whole lot easier to say.
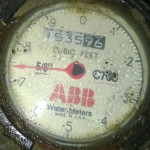
Having said that, I do find it quite irritating that water departments bill you for water in hundred cubic feet or HFC instead of gallons. A hundred cubic is equal to 748 gallons.
In Los Angeles, your water departments Tier I residential limit might be 24 HFC. Why not just express it on our water bills as 17,952 gallons? You might even be able to see the reduction of your water use on your monthly bill when you last reduced your watering from 7 minutes to 5 minutes. Yes I know that water meters measure it in cubic feet but they could convert it into something more meaningful to the average homeowner.
Here are a number of ways you might see water measured by:
Acre-foot (af) - Stored water
1 acre-foot = 325,851 gallons of water.
1 acre = 43,560 square feet.
1 acre-foot = 43,560 cubic feet.
Cubic feet per second (cfs) - Moving water
1 cubic foot = 7.4805 gallons.
1 cubic foot per second = 7.4805 gallons flowing by a particular point in 1 second.
1 cfs = 1.983 acre-feet per day = 646,320 gallons = 2447 cubic meters of water.
1 cfs is equivalent to 448.8 gallons of water flowing per minute.
1 cfs will produce 724 acre-feet of water per year.
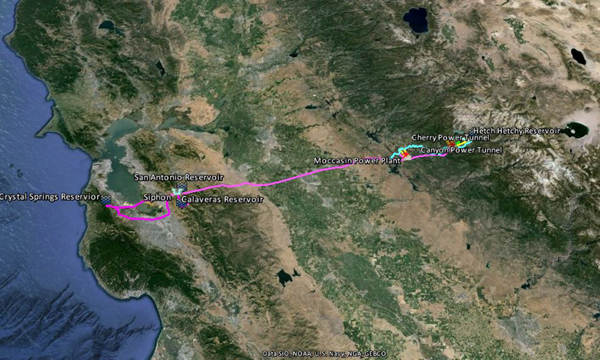
For those of you interested in seeing the Hetch Hetchy Aqueduct up close on Google Earth. Download the Hetch Hetchy KML in the library on the right and open it in Google Earth. This a pared down version of my more complete KML but it still has a lot of stuff to explore. The library now includes the LA Aqueduct, Colorado River Aqueduct, State Water Project and Hetch Hetchy Aqueduct.
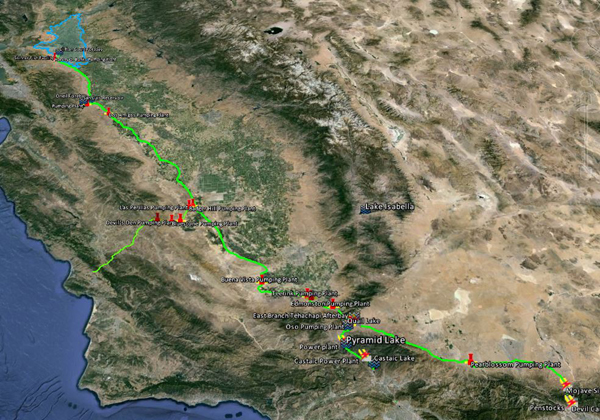
For those of you interested in seeing the State Water Project up close on Google Earth. Download the State Water Project KML in the library on the right and open it in Google Earth.
This a pared down version of my more complete KML but it still has a lot of stuff to explore. The library now includes the LA Aqueduct, Colorado River Aqueduct and the State Water Project.
For the most part there is zero conversation inside city hall about managing water demand by slowing or perhaps putting an indefinite hold on approving water supply assessments and construction permits. Today's growth in Los Angeles is 'big', it's 'dense' it's 'vertical' and it's pervasive.
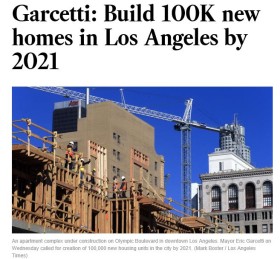
Mayor Garcetti last September announced that he wants to expedite construction to build 100,000 new units by 2020 but where's the water?
Clearly there is a disconnect between the city's growth ambitions and the effort to force residents to comply with drought restrictions. Regardless of how efficient the projects are, they still create a huge demand for water when there is already a huge deficit.
Cities throughout California, particularly Southern California need to re-assess their plans for growth and throw away their compliance for bad laws like SB 1818 and housing policies like RHNA that blindly approve developments to meet SCAG's or SANDAG's desktop population targets without assessing if there is sufficient water to provide for them over the long term.
Pictured above: The Playa Vista II development will add 560 af/y demand to the city's water deficit.


 Over time, it became apparent that this is not simply a miscalculation but likely an intentional effort by the city to mislead the public using ‘paper water’.
Paper water is water that utilities claim they have access to, but is difficult or impossible to access for various reasons. You can't drink paper water or cook with it but you can make lots of promises with it.
The
Over time, it became apparent that this is not simply a miscalculation but likely an intentional effort by the city to mislead the public using ‘paper water’.
Paper water is water that utilities claim they have access to, but is difficult or impossible to access for various reasons. You can't drink paper water or cook with it but you can make lots of promises with it.
The 
 In Los Angeles, your water departments Tier I residential limit might be 24 HFC. Why not just express it on our water bills as 17,952 gallons? You might even be able to see the reduction of your water use on your monthly bill when you last reduced your watering from 7 minutes to 5 minutes. Yes I know that water meters measure it in cubic feet but they could convert it into something more meaningful to the average homeowner.
Here are a number of ways you might see water measured by:
Acre-foot (af) - Stored water
In Los Angeles, your water departments Tier I residential limit might be 24 HFC. Why not just express it on our water bills as 17,952 gallons? You might even be able to see the reduction of your water use on your monthly bill when you last reduced your watering from 7 minutes to 5 minutes. Yes I know that water meters measure it in cubic feet but they could convert it into something more meaningful to the average homeowner.
Here are a number of ways you might see water measured by:
Acre-foot (af) - Stored water
 Cities throughout California, particularly Southern California need to re-assess their plans for growth and throw away their compliance for bad laws like SB 1818 and housing policies like