The state’s biggest challenge in meeting the population’s water supply requirements isn’t conservation, it isn’t lack of infrastructure, not storage, and not groundwater. It’s RHNA, a little known wonkish piece of legislation embodied in Government Code 65580 that's mostly known to planners, developers and city hall staffers.
 What follows might sound like we’re veering away from the focus of this blog but stick with it, RHNA affects water demand (and electric power and traffic) in a very heavy handed, mindless way. You’ll see why.
State Level RHNA
RHNA (Regional Housing Needs Assessment) is a law that requires the state Department of Housing and Community Development (HCD) to establish the region’s existing and projected housing needs. RHNA prods and some might say it threatens cities into produce housing and while it presses for growth, nowhere in the state level is there an evaluation as to whether the water supply is available.
The RHNA process starts out with population projections generated by the state’s Department of Finance (DOF). These population figures are then sent to HCD which takes this data and develops regional housing (RHNA) allocations. The allocations, spread out evenly between Northern and Southern California, are distributed among 38 regional planning agencies through a RHNA Determination Letter.
Regional Level RHNA
Every region in the state has a planning agency that assigns housing allocations to the cities and communities they oversee. When regional planning agencies receive the Determination Letter, they take the regional RHNA allocations in it and break it down to city level RHNA allocations. When the HCD sent Southern California its Determination Letter showing RHNA allocations (pdf), the Southern California Association of Governments (SCAG) was assigned to provide between 409,060 and 438,030 housing units to be spread out among its 191 cities inside Los Angeles, Orange, Riverside, San Bernardino, Imperial and Ventura counties. The planning agency that represents San Diego (SANDAG) was assigned to provide 161,980 units.
To name a few other regions, if you live in Fresno its planning agency (FCOG) was assigned a RHNA allocation of 41,470 housing units. Kern’s planning agency (KCOG) was assigned a RHNA allocation of 67,675 housing units and the San Francisco Bay Area agency (ABAG) was allocated to provide for 187,990 new units. Regional planning agencies simply accept the HCD numbers at face value.
This step in the RHNA process tends to get a little ugly. Using a number of factors such as jobs, density, transportation, income levels, developable land, the regional planning agencies divide up their regional allocations into city level RHNA allocations (pdf). The regional planning agencies do not evaluate whether there is a sufficient water supply available to support housing requirements when they impose the allocations on the cities or communities. This is where the disconnect, intentional or not begins.
Some cities like Los Angeles accept these housing allocations with reckless abandon and run with it while other cities like Irvine, Palmdale, La Mirada and Pleasanton have tried unsuccessfully to challenge the regional agencies role and RHNA allocations in courts. In Irvine, the city had designated a decommissioned naval base to be the site of the “Orange County Great Park’. However, SCAG saw its potential as a huge housing development and applied a RHNA allocation of 35,660 units to the city. Pleasanton sought to limit growth with caps that were approved by voters but was sued because their housing plan they did not comply with RHNA.
City Level RHNA
The next and final step in the RHNA process is at the city level. Each city after having received their share of RHNA allocations must now incorporate it into a housing plan called the ‘Housing Element’. The Housing Element identifies the locations of all the parcels in the city that are candidates for higher density growth and is one of the eleven 'elements' that goes into a city's 'General Plan'. This is effectively the only place throughout the RHNA process where water supply comes into play, albeit indirectly.
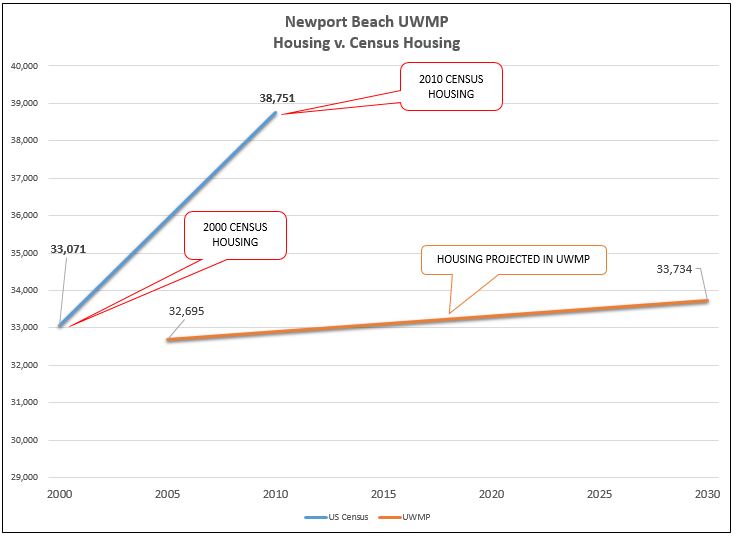
The Housing Element does not evaluate whether there is a sufficient water supply available to support housing requirements. Instead it leaves it up to the water agencies UWMP. In the City of Los Angeles’s Housing Element, it has a section on ‘infrastructure’ where water supply is brought up. Here, the plan cites the 2010 UWMP stating “there is an adequate supply of water to serve the population growth projected through the year 2030, beyond the Housing Element planning period.”
Clearly the adequacy of the water supply in Los Angeles is demonstrably untrue, but there is no regulatory oversight anywhere in the RHNA process that will halt a project when there is no water to support it. If the water plan is based on faulty assumptions, the project will glide through to approval making it nearly impossible to create a reliable water supply.
Challenging RHNA is not possible. Courts say they have no jurisdiction. Challenging the water is one of the few areas where housing allocations can be reduced but it’s not part of the regulatory process. In “Show Me the Water Plan (E. Hanak/PPIC)”, the paper states that “planning laws (SB 221 & SB 610) rely largely on citizen enforcement rather than regulatory oversight by the state” and “that citizens can challenge the responsible local agencies in civil suits.”
Challenging water supply has been done from time to time by highly motivated groups of citizens. In “California Water Planning 2009 Vol 4 Reference Guide”(R. Waterman) this study described one such instance when a Santa Clarita group called “Santa Clarita Organization for Planning the Environment” challenged an EIR for a project involving 2,545 homes, a retail center and 42 acres of community facilities. In (SCOPE) v. county of Los Angeles, The judge agreed and the court rejected the EIR stating that the “county’s approval of the West Creek EIR is not supported by substantial evidence (of available water).”
But while its happened from time to time it’s not a process that citizens are familiar with and having citizens challenge thousands of projects a year one by one to enforce SB 221 and SB 610 (the “Show me the Water Laws”) is an undue burden. Furthering the burden, the State has legislation such as SB 1818 that allows cities and developers to squeeze more units into a parcel even when its zoned for lower densities.
Cities are not likely to challenge a developers rights to construct housing if the allocations have not been met. RHNA’s complicated process give developers the legal foundation to build new housing and sue if cities don’t cooperate, even when it is obvious to everyone that there is no water available for the project.
So where’s RHNA going to take us?
 RHNA is driving up water demand. The Housing Element is updated every eight years and new RHNA allocations come out for each new refresh so what we see every eight years are just small chunks of the housing allocations which keeps the long term past and future view pretty well hidden.
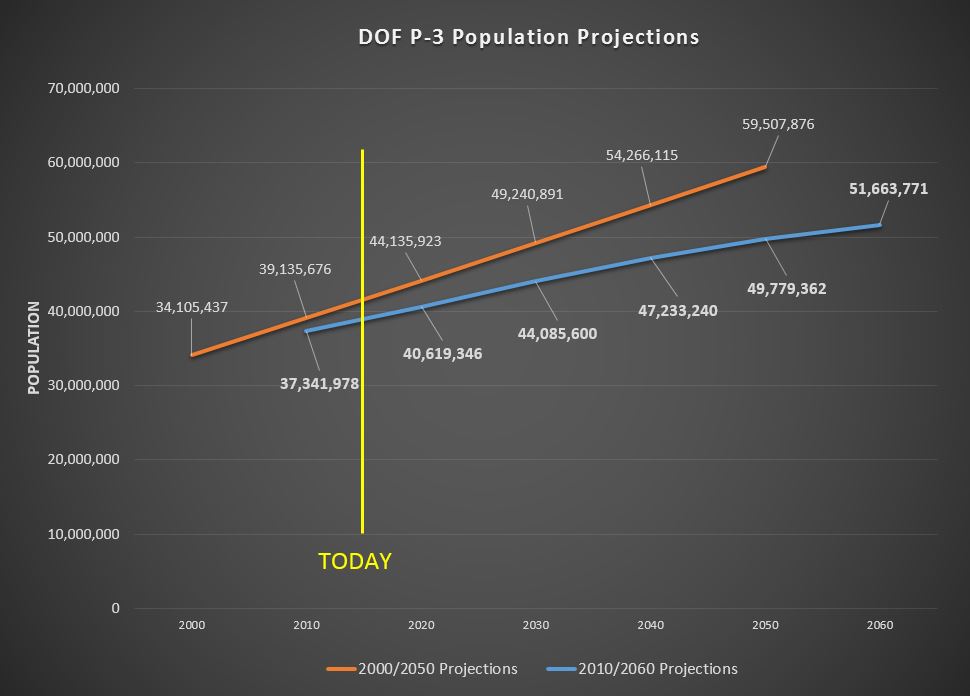
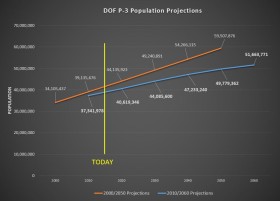
Because RHNA takes its cue from DOF population projections which extend 50 years, if you want to know where RHNA is taking us look no further than the DOF P-3 projections.
These fifty year projections can swing up and down quite a bit. The 2050 projections were reduced 10 million people between the 2006/2014 and 2013/2021 but the damage is already done despite the reduced projection.
L.A.'s last RHNA allocation was 112,876 and it led to a large number of permits being approved though not all of them were necessarily built given the economic crash that occurred in 2008. However, once entitled, they stay entitled. When the economy picks up, the construction can begin. The latest RHNA allocation for Los Angeles dropped to 82,000.
The current DOF projections show the state growing to a population of 51,663,771. With this we can expect the RHNA to increase the density to increase 16% by 2030 and by 32% by 2060. A 32% increase in the City of Los Angeles suggest that water demand would increase over 938,000 Af/y if the city’s demand was held at the current 142 gallons per capita daily. That’s is about 356,000 acre-feet a year over the city’s actual average supply.
But realistically, if the RHNA process continues unrestrained by water supply, the city would have to reduce the demand to 88 gallons per capita daily to meet 2060 population targets. This is not “residential gpcd”, this is the entire city’s demand including commercial, industrial, government and residential! And what's worse.. this is just the City of LA. Imagine how disastrous and frequent droughts will be when the state hits its 16% growth target by 2030 and 32% target by 2060.
California can never have a reliable water supply unless serious reforms are made to RHNA.
(updated on 6/14/2015)


 Can you buy paper water? Absolutely.
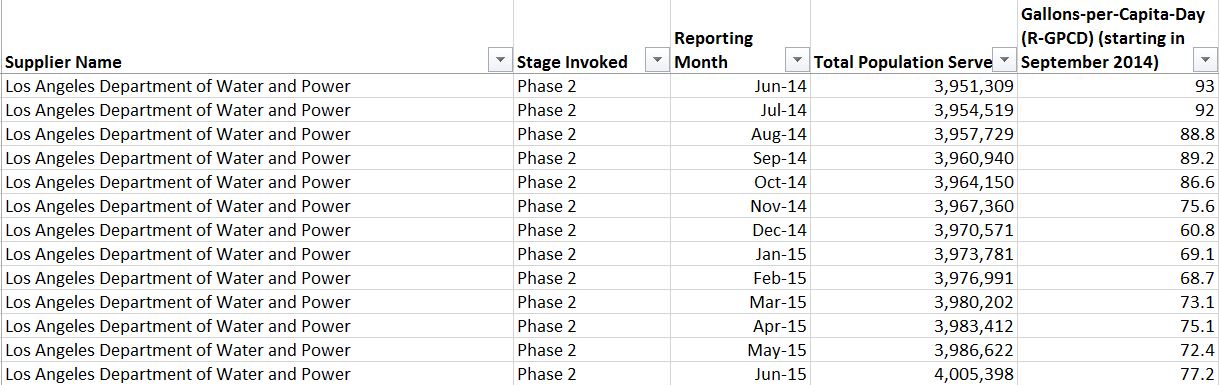
 The DWP’s water assessments are akin to a Hollywood movie set whose front facing facades of old western towns look like the real thing but when you step through a door all you find is an empty lot.