With the availability of imported water dramatically falling and local supplies (recycled water and groundwater) not meeting projections, the LADWP had to scramble to come up with ways to develop new supplies or create the perception of sufficient supplies for future growth. Or both.
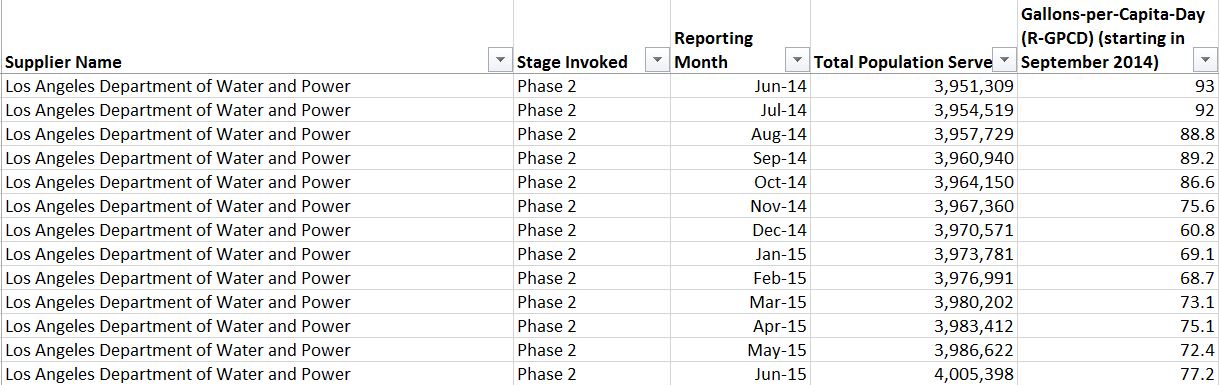
 This would require some creative thinking by the department pie charts in past water plans cited only four sources of supply that make up the city's water supply which were the LA Aqueduct, Groundwater, MWD, and Recycled water.
In the 2010 UWMP the department settled on three new sources. Two of these sources were 'Conservation' and ‘Stormwater Capture’. The third will be discussed at a later date.
To date, five years after they were announced, neither of these sources have been measured and reported to the city’s Board of Water and Power Commissioners in its monthly reports so this information is not made public. Without reporting this, there is no way to independently verify the claims made in UWMP's and Water Supply Assessments. The reasons they are not reported should be apparent as we discuss them below.
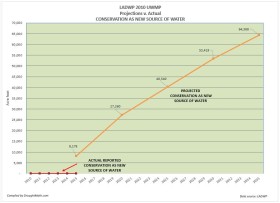
CONSERVATION – As described in the 2010 UWMP, conservation is a “continuation of rebates, incentives, promoting new technologies and reduced outdoor water use.”
There is a problem with this description however in that it is not ‘new’ water. Conservation is not a source of supply that contributes 'new' water to the 700,000 Af/y supply which the LADWP says will grow to by 2030. It merely stretches out water that was already been counted as new water. This is essentially a form of double-dipping so it should be treated as paper water.
When individuals use less water for any of the reasons described above this doesn’t add to the supply, it merely stretches out the supply or allows it to be re-allocated to other uses such as new construction.
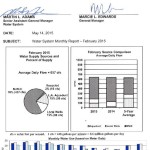 'Conservation’ doesn't show up on monthly reports to the Board of Commissioners because it is not new water, and it can’t be precisely measured. Furthermore, whatever figure can be estimated it would have to show up as a credit which would help lower the city’s projected annual demand. If the department lowered the projection then it would not show a growing water supply which would presumably make WSA’s a harder sell.
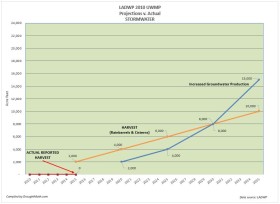
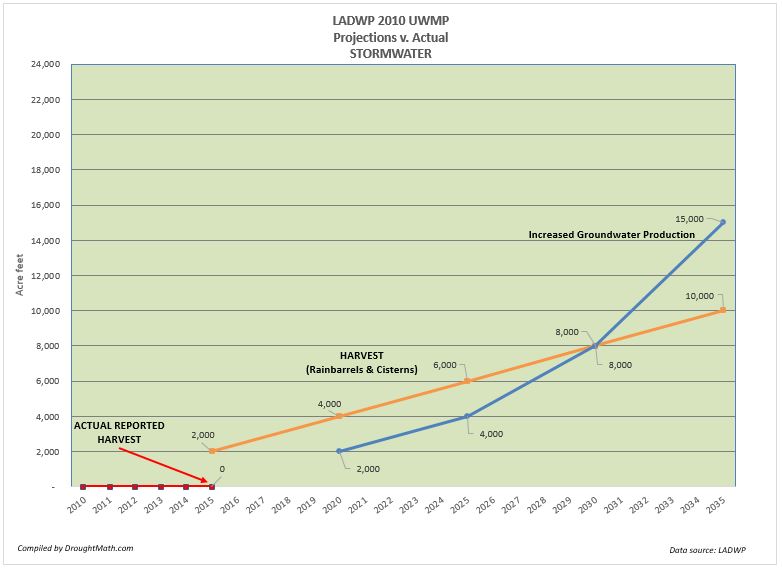
STORMWATER CAPTURE – The ‘Stormwater capture’ supply is divided into two sub-categories that together, the department claims will produce 25,000 Af/y of water. These sub-categories are ‘Increased Groundwater Production’ and ‘Capture and Reuse (Rainwater harvesting)’.
In the first sub-category, Increased Groundwater Production is a source that the department says will produce 15,000 Af/y of new water. LADWP is rehabilitating and increasing the capacity of its spreading grounds that will result in the increased groundwater production. When stormwater is captured, it is directed towards spreading grounds where the water percolates or is pumped into the ground for storage and later pumped out as groundwater pumping. This new water adds to the supply and can be measured as stormwater enters the spreading grounds.
However, because these figures do not show up on monthly reports to the Board of Commissioners, there is no way to verify if the department is meeting its 15,000 Af/y targets and until that is done, this claim should be treated as paper water.
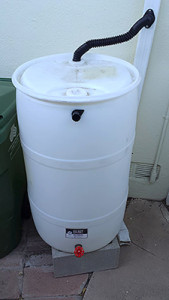 In the next sub-category, Capture and Reuse (Harvesting) is a source that is divided between rain barrels and cisterns. The department claims that Rain barrels will contribute 2,000 Af/y and up to 10,000 Af/y in 2035 to the supply. This figure is highly suspect at best because it can't be measured and it includes a lot of assumptions that makes reaching the goal unlikely.
The department sets up a scenario to assuming 400,000 residents will have a rain barrel sitting aside a 500 square foot roof located in an area where it rains an average of 15” per year. How they come up with 2,000 Af/y is anyone's guess. You would need 11 million rain barrels to store 2,000 AF which is 651,702,000 gallons. However, the bottom line is this cannot be verified. With no gages, no monitoring and no reporting, the department shouldn't be touting it as a supply. Treat this as paper water.
The department is even more vague about cisterns which function like rain barrels but are a much larger. The scenario the department sets up to collect 8,000 Af/y is simply that they will be sited ‘on-site for schools and governments only’. It doesn’t say how many cisterns are needed or how large they are and it doesn't say where they will be located. Here again, no gages, no monitoring and no monthly reporting to the board. Trust us seems to be the prevailing message for the Harvesting sub-category so this should be treated as paper water.
In summary, only half of the Stormwater Capture supply (higher capacity spreading grounds) can be considered new water which adds to the city's water supply. The other half (harvesting) can't be measured for participation and effectiveness so it falls into the category of paper water. And with Conservation, this is another example of paper water since it also does not add to the water supply.
To be credible, UWMP’s and water supply assessments must be based on reliably collected data from all of the historical supplies they cite as sources. Trust us isn’t good enough.


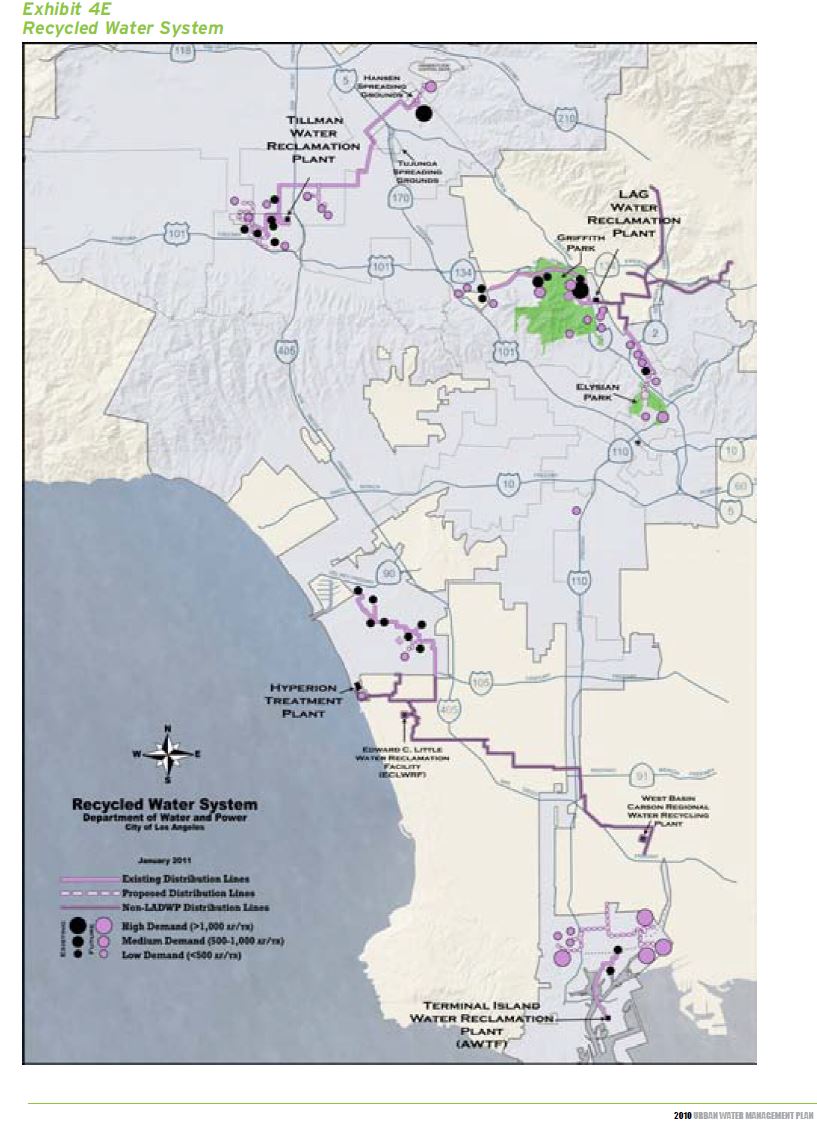
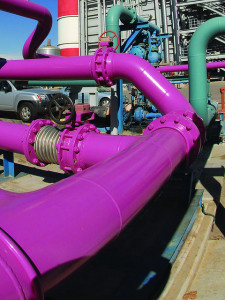 However when perception meets gritty reality, purple pipes contribution to the city's water supply is simply underwhelming and not deserving of so much attention. Past LADWP water plans told us recycled water was supposed to deliver be delivering ~30,000 Af/y to the city by 2015. But instead the city's been getting an average of only 7,600 Af/y.