Water supply assessments for two large projects have been approved by the LADWP water resource planners and is coming to the City of Los Angeles Board of Water and Power Commissioners on June 2 for approval.
The LADWP cites its own 2010 UWMP claiming there is sufficient water for these two projects through the year 2035, and enough for all other "existing and planned future demands".
The 2010 UWMP they cite projected that the city would be receiving a yearly annual total supply of 614,800 Af/y by 2015. That would be made up with 252,000 Af/y of LA Aqueduct supply, 40,000 Af/y of ground water and 20,000 Af/y of recycled water.
Given the bad news the entire state has been dealt with over the last three years and the city is begging residents to rip out turf in an effort to conserve,it would be understandable if you thought that the city wasn't quite meeting its water supply targets. You would of course be right to think that.
The problem with the assessments for these projects is that since the approval of the 2010 water plan, the DWP's total water supply has averaged just 550,887 Af/y which 10% a year short of what it needs to meet the city's needs. When we look at the categories that make up the supply we find that the recycled water supply is short of its 20,000 Af/y by 84% at just 7,392 Af/y. Groundwater to date is ahead of the 2010 projection by 60% but is unlikely to meet 2020 through 2035 annual projections due to its cyclical nature. The 2010 UWMP plan also cites 40,000 Af/y of transfers for which there is no evidence of receiving and it counts 14,180 Af/y of 'conservation' as new water which it is not.
The 2010 UWMP is stuffed full of water that simply can't be accessed and is plainly 'paper water'.
How the Board of Water and Power Commissioners can approve these projects with a straight face given the severity of the drought is anyone's guess. The city appears to be in a 'state of denial' when it comes to the shortage as it approves these projects big and small. But it's also in a 'state of crisis' when it comes to prodding the public into conserving. It can't have it both ways.
Editors note: The DWP has not met any long term water projections outlined it its plans since 1990.
A couple of indie films of note. The first I'd like to mention is The Longest Straw. You gotta appreciate a few young people who recognized the importance of the Los Angeles Aqueduct that they decided to hike along the entire route to make a documentary of it.
Not sure if they make the hike into some of the more out of the way locations such as the construction camps at Water Canyon, Sun Canyon or Pine Tree where Mulholland's men tunneled through parts of the Southern Sierras but 400 miles is 400 miles. That's a pretty big challenge.
Secondly I would like to mention Slake: Water & Power in the Eastern Sierra. I spotted this film on the internet as I was researching the LA Aqueduct for my KML a few years ago was. I don't know if they ever finished the film but the video is very moving.
If you know of any more please email me or tweet me with your suggestions at @dcoffin.
This is Part IV in a series describing L.A.’s water supply problems and the policies that produced it.
In Part III we saw how the city sought to maintain the 1985 baseline of ~175 gallons per capita daily in the 1990 UWMP while population estimates increased. As a result we saw the projected supply in the plan jump significantly from the previous plan. We also found that the DWP heavily leveraged the projected 1990 supply in the groundwater and recycled categories using water it had no chance of getting. These factors continued into the 1995-2000 UWMP's.
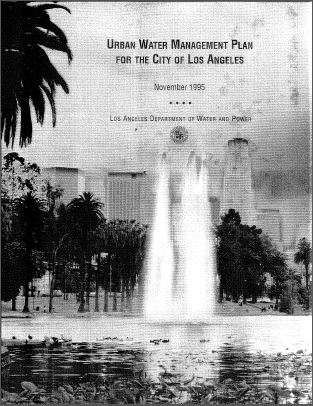
The 1995 UWMP - L.A.'s 3rd Water Plan
The 1995 UWMP should best be known by the city’s acquiescence that water supply had its limits. Population estimates from the Southern California Association of Governments (SCAG) did not climb as dramatically as they had in the 1990 plan but the increase from 3.85 million to 4.25 million by 2015 (9%) was still the driving factor.
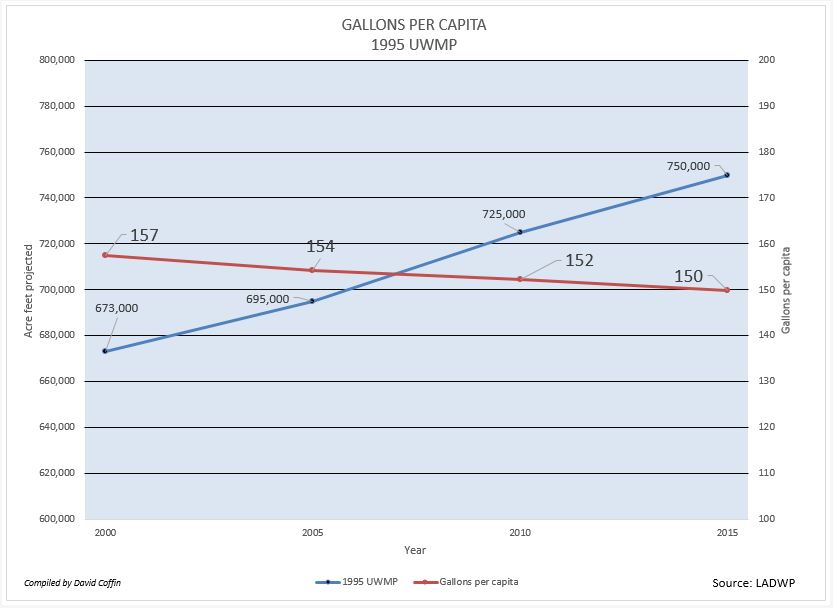
With future growth estimates continuing to drive the supply requirement of more water, DWP planners were forced to set a new precedent by reducing the per capita supply from 177 gallons per capita to 150 gallons acknowledging that less water would be coming through the Los Angeles Aqueduct due to recent court ordered restrictions of Mono Basin water and at current allocations, future growth would have demanded ridiculously large amounts of water that couldn’t be met.
Figure 1 - Big jump to reduce per capita supply
If the DWP planners tried to sustain the 177 gallons per day cited in the 1990 plan, the projected supply in the new plan would have shot up to 757,000 for 2000 and risen to 886,000 acre feet per year (Af/y) by 2015!
Historically though, reducing the per capita supply to 150 gallons per day per capita would not be enough. At this allocation the DWP suggested that it would have 695,000 Af/y by 2005 and could gradually increase that to 750,000 Af/y by 2015 (Figure 1). But in the years following the approval of the plan, the actual supply figures that came in would demonstrate the DWP's failure to achieve these projections suggesting that there was far too much paper water in the projections to be viable.
DWP planners accepted that less water was going to be available through the aqueduct system and reduced the aqueduct supply by 20,000 Af/y to 360,000 Af/y in the 1995 plan.
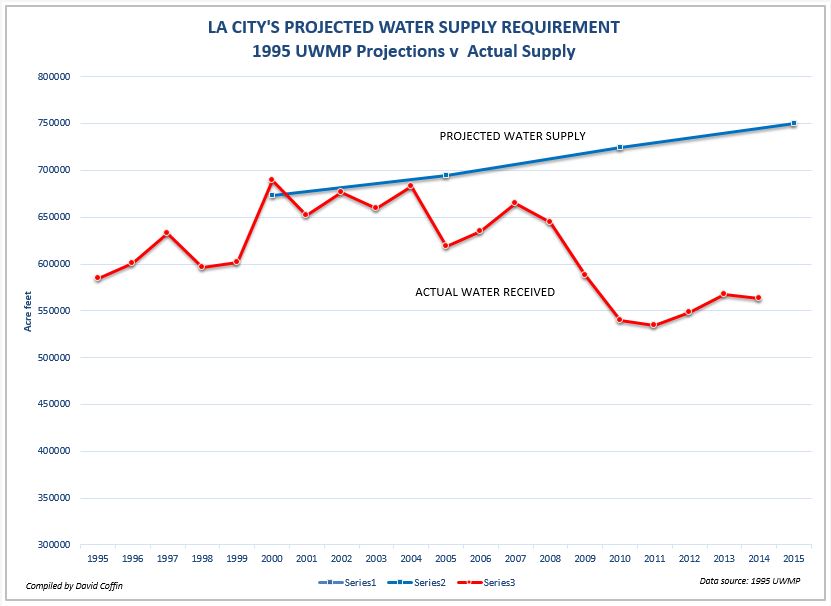
Fig. 2 - 1995 Projections vr. Supply
To offset the loss of aqueduct water, DWP planners suggested that they could increase the already large projections of the 1990 plans and increase the availability of recycled water to 38,000 Af/y, and groundwater to 152,000 Af/y.
Through the years though, none of these figures would ever be achieved. Recycled water averaged a mere 2,300 Af/y and groundwater averaged just 87,000 Af/y proving the plan wasn’t working.
The historical significance of the 1995 plan was that the DWP would only muster up an average of 638,490 Af/y (Figure 2). Far less than the 750,000 Af/y that it promised. Because of the paper water fueled growing deficit, the DWP would start prodding the public into reducing its demand using such schemes as tiered pricing, washer rebate programs and require that all homes install low-flow toilets before resale.
The 2000 UWMP - L.A.'s 4th Water Plan
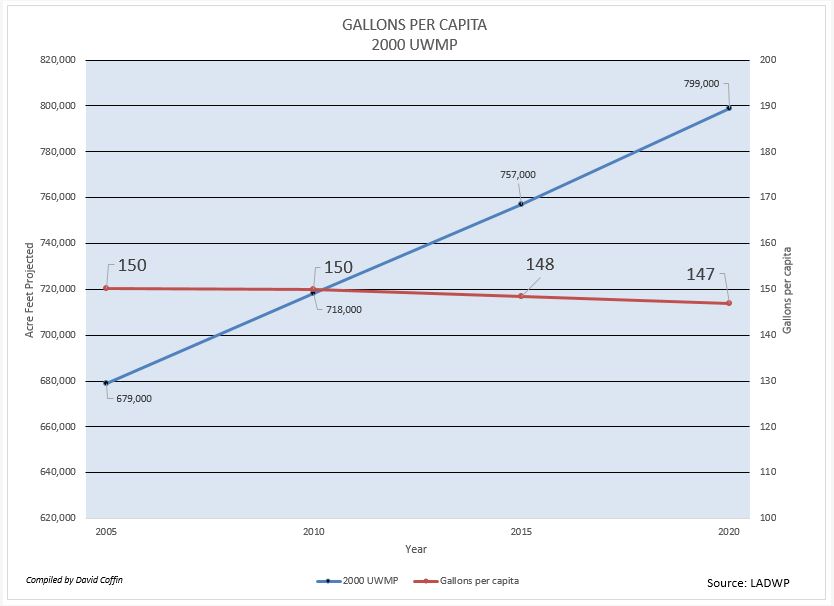
Figure 3 - Lower per capita and rising demand
L.A.'s fourth water plan might best be known as having to largest projected supply that the DWP said it could meet of any of the city's UWMP's. This monster projection occurred even as the department further reduced the gallons per capita daily water supply. The reasons were due to estimated population projections supplied by SCAG.
The new SCAG population estimates started out at 4,035,305 by 2005 population and would grow to 4,856,887 by 2020. These new population figures when figured into the new per capita allocations created a demand that would skyrocket to almost 800,000 Af/y.
The 2000 UWMP lowered the 'year 2005 supply per capita' of the previous plan from 154 to 150 gallons per day and from their it would ratchet down the consumption further to 147 gallons per day by 2020. (Figure 3)
But the lower allocations would still generate a sharp rise in demand. The DWP said it could supply 718,000 Af/y of water in 2010 and sharply increase in to 799,000 Af/y by 2020. The increase though didn't come from increased recycle and groundwater.
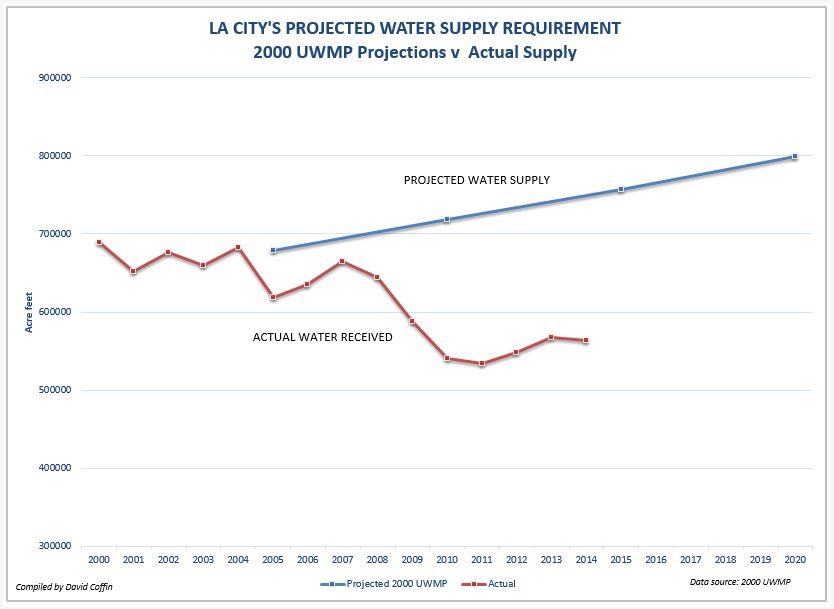
Figure 4 - 2000 Projection vr. Supply
Perhaps realizing that developing a recycled water system and pumping more groundwater was not paying the dividends they predicted earlier, the city ended its long standing resistance to relying on pricier MWD water and would ratchet up purchases of water from 200,000 to 298,650 Af/y which would nearly equal the aqueduct supply level.
Planners were forced to lower the recycled water projections 28% from 38,000 to 29,350 Af/y. Groundwater projections fell only slightly from 152,000 to 150,000 Af/y but aqueduct projections fell significantly from 360,000 Af/y to 321,000 Af/y.
The historical significance of the 2000 UWMP was that the DWP would only be able to deliver an average of 617,000 Af/y from 2000 to 2014 which was well under the promised 757,000 Af/y by 2015 and light years from the 799,000 Af/y it said it would have in 2020 to meet the city’s growth. (Figure 4)
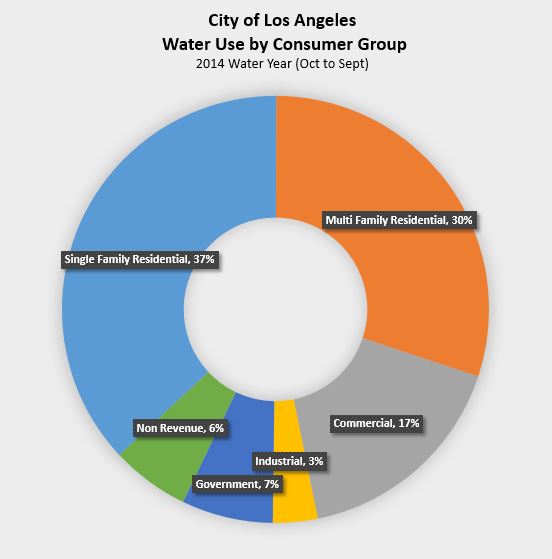
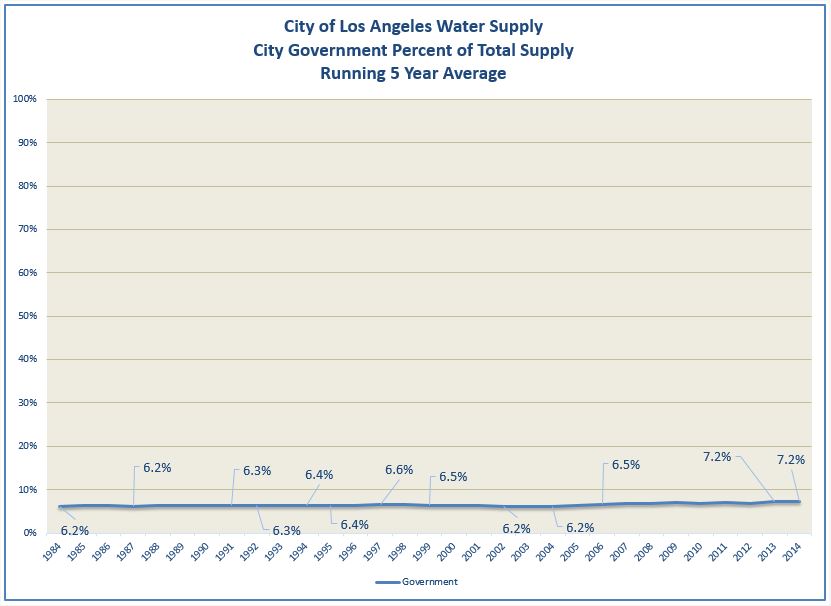
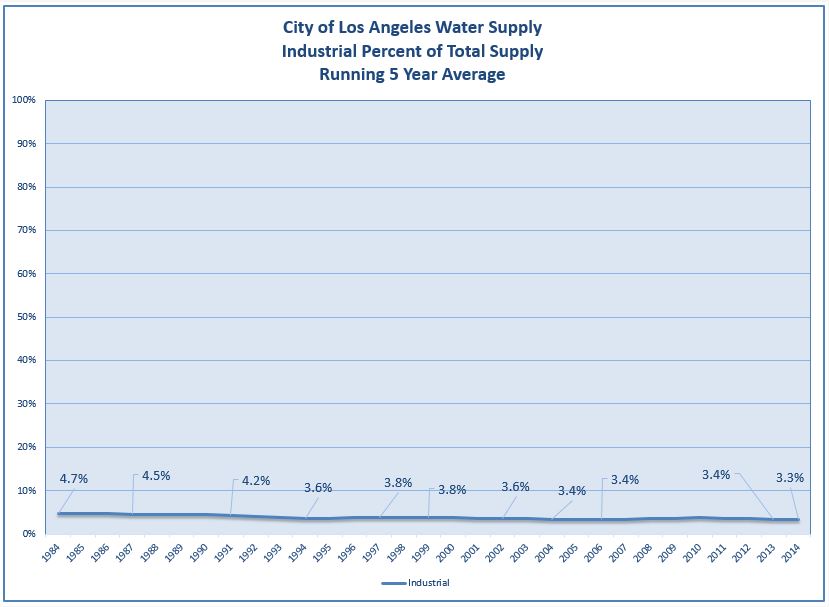
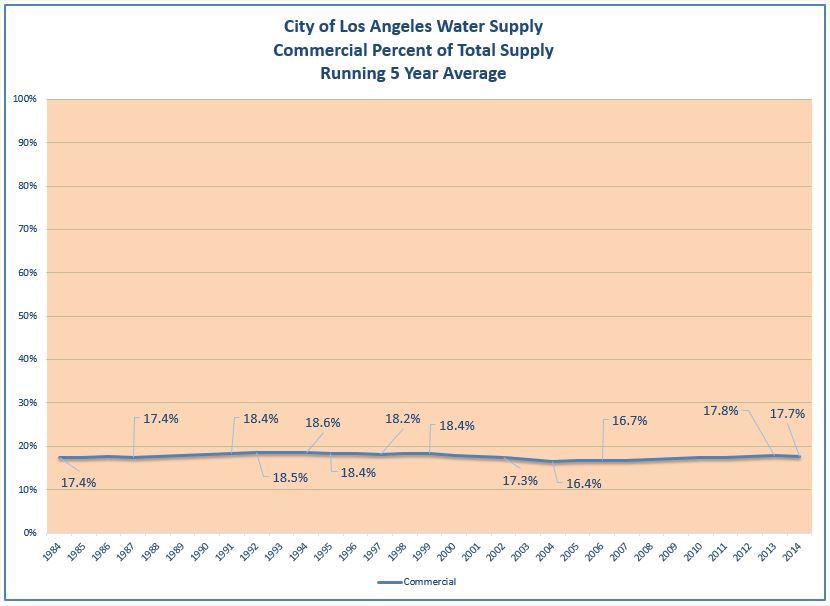
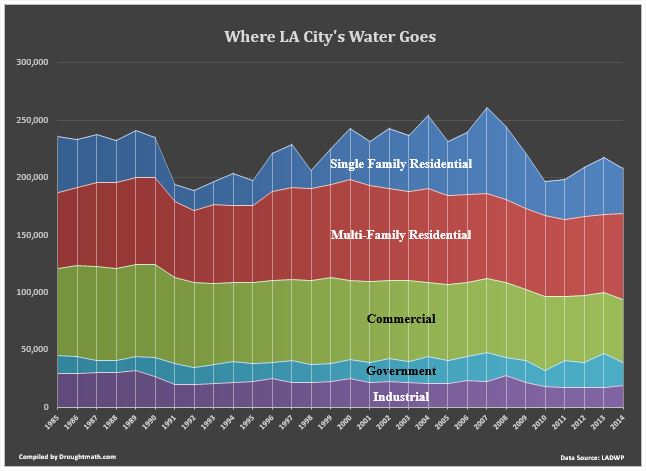
In another earlier post we saw 'how much' water each consumer group in the City of Los Angeles used. Here is a comparative look at where the water goes by percentage.
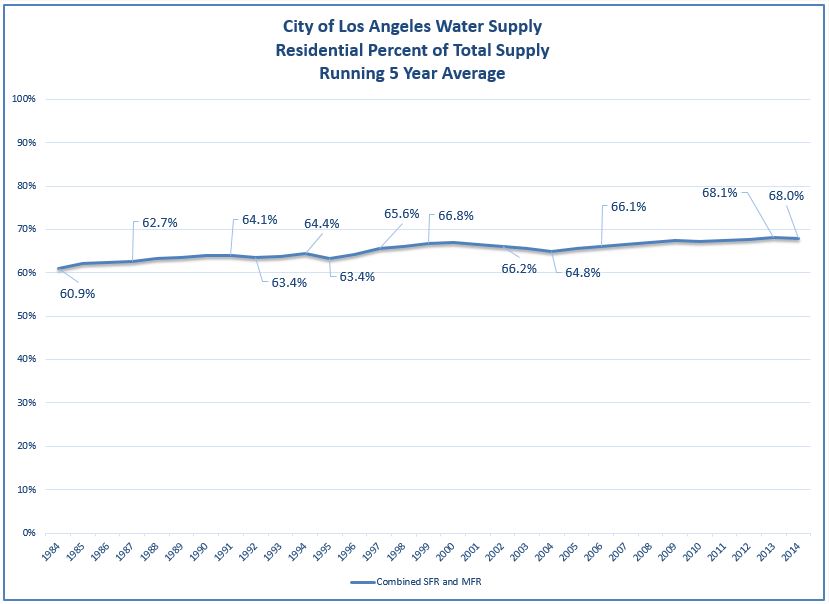
Next we see both where the growth or reductions in share are between 1984 and 2014.
Residential share increased from 60.9% to 68% (12 percent change). Commercial was relatively flat at .3 percent from 17.4% to 17.7%. Industrial share fell from 4.7% to 3.3% (30 percent loss) of total supply while City Government increased from 6.2% to 7.2% (16 percent change) of total supply.
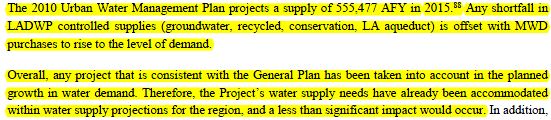
Construction projects going through the city permit process are required to cite how much water demand they will impose on the city's water supply and whether the city has surplus water supplies to accommodate the project.
2010 UWMP states that MWD would make up for city shortfalls.
This information is provided in the EIR (Environmental Impact Report) which is part of the permit package for the project. The EIR's have a section on 'Utilities' stating where this surplus water will come from. As evidence of sufficient surplus water, the EIR's refer you to the city's current UWMP as evidence. The UWMP also describes how it will meet demand should there be a shortages of city owned water. When water shortages occur the city's water plans state that they have access to MWD supplies that will meet the city's level of demand.
The chart below shows us that despite the UWMP's guarantee that the Metropolitan Water District will be able to provide sufficient water supply in dry years, the DWP has not been able to meet that guarantee since MWD supplies have come up short of the projections every year since 1990.
The deficit the city finds itself in is a result of this gap. Because this has been allowed to occur for twenty five years and never corrected in each subsequent UWMP, we have to assume that these statements in the UWMP assuring that MWD will meet demand are mainly intended to facilitate approvals and nothing more. As such, it is a planned deficit.
MWD supplies DWP water during shortages but has not been enough to meet the city's demands.
L.A.’s recent drought has been going on far longer than the statewide drought. California’s last drought was declared in 2008 and ended in 2011 and another declared in 2015. L.A’s drought was declared in 2008 and was never rescinded. So why has L.A.’s drought been so persistent and growing by the day? This brings on another question we should ask is how does the city reconcile the endless approvals of new construction during a persistent drought?
The short answer to both is that in order to provide evidence of sufficient water supply for projected growth, the city’s UWMP (Urban Water Management Plan) has been reporting that is has far more water available to it than it can get. Every UWMP from 1990 till now has projected supplies that exceeded 700,000 AF but when we look back at DWP records from 1990 to 2004 we find that the city’s total supply averaged just 627,000 Af/y. Since 2005 the average has fallen even further to just 590,000 Af/y. Simply put, the DWP has never met their projections and that has steered us head-on into a drought.
When DWP officials are asked why they haven’t met the projections cited in the UWMP, using a little spin they tell you that conservation efforts reduced demand and they didn't need to import as much as projected.
This routine answer however is disingenuous since the projections include future growth and clearly the DWP hasn’t met that expectation given today’s restrictions on water. The 1985 UWMP set the city’s baseline water at 175 to 176 gcpd (gallons per capita daily). This number reflected the current level of water to residents, businesses, and industry, it included various conservation programs such as low-flow hardware devices and left room for projected population growth to 3.41 million by 2010. At this level the city cited that it would be able to meet the demand with a very reachable water supply of 667,300 Af/y.
In 1990 however, the city’s population increased faster than the population projections that were cited in the earlier plan. Population projections in the new plan were now 14% higher and in order to maintain a similar per capita supply level and still meet projected growth, the plan’s total demand and supply projections jumped 13 percent to a not so believable 756,500 Af/y by 2010.
In each of the subsequent plans from 1995 to 2010 would continue to cite available supplies over 700,000 Af/y and as high as 799,000 Af/y.
Conflicting Demands
So now the city was confronted with two conflicting demands. The first would be to provide enough water from a now shrinking supply that once averaged 680,000 Af/y and has now fallen to just over 610,000 Af/y and still meet the city’s need. The second was to show that its supply was growing and that it would be sufficient for continued growth.
In an attempt to solve the first problem, the city’s 1995 water plan would have to ratchet down the per capita rate to 150 gallons per day to lower the total demand otherwise we would seen demand in excess of 875,000 Af/y. However even 150 gallons per day wouldn’t be enough over the short term and the city would also have to implement more draconian methods to lower the per capita further by imposing an Emergency Water Conservation order on single family residents and reducing residential billing unit allocations.
The second problem to show a growing water supply over the long term to meet the city’s growth ambitions would require a little sleight-of-hand by the DWP using ‘paper water’.
Paper Water
Paper water by definition is “water that an agency says it has available to it, but its water that is difficult or impossible to access.” and paper water can be measured by the gap between what an agency says it has available to it, and what it eventually gets. The wider the gap, the deeper our problems.
California’s water laws require that planning agencies, and developers show evidence of current and future water availability for their project. EIR’s and water supply assessments all rely on the projections cited in the UWMP so there is a great deal of pressure on the DWP to show that the water supply is growing, where the supplies are coming from and how much. If the water plans did not show evidence of future water availability that was sufficient to match population projections this could greatly hamper the approval of their projects and possibly stop them cold. In fact some cities in California today have stopped issuing water meters to new subdivisions for residential because they have no surplus of water.
So where do we find the DWP’s paper water? With a little digging into the city’s past and current water plans we can find it in literally every category of the city’s water portfolio in literally every water plan.
Paper Ground Water
City never met its groundwater projections
Our first stop to find paper water is in the DWP’s groundwater projections that are cited in each of the UWMP’s approved by the city between 1990 and 2010. The accompanying groundwater chart shows us a 79,500 Af/y gap between what the DWP says it would have to meet the city’s growth and the actual amount of groundwater the DWP had access to.
For example if we look at the groundwater projections in the 2000 UWMP, groundwater was projected to contribute 133,000 Af/y by 2010. However the average amount received between 2005 and 2014 was just 66,431 Af/y creating a 56% deficit of what they projected. This 56% is what we call paper water because these same conditions arise in each of the other water plans approved by the city. 36% of the groundwater projection cited in the 1990 UWMP was paper water. 51% of the 1995 UWMP’s groundwater was paper water, and in the 2005 UWMP it is 39% paper water.
Over 24 years this paper water would represent about 1,088,000 AF of water that the DWP said it would have to meet projected growth but over time it would never receive.
The city never stood much chance to meet these projections. Growth, fueled by paper water is at the center of blame. LAStormwater.org states that the city captures just 27,000 Af/y of storm water a year to recharge the underground storage. This low rate is attributed by ULARAwatermaster.com to the city’s built-out growth which has impeded the capture of groundwater because so much permeable soil is paved and built over. The Upper Los Angeles River Area Watermaster reports that most of today’s groundwater recharge comes primarily from LA Aqueduct and Metropolitan Water District imports. Further restricting groundwater pumping is that many wells were found to be contaminated in the mid 2000’s and had to be taken out of service.
Paper Recycled Water
City never met its recycled water projections
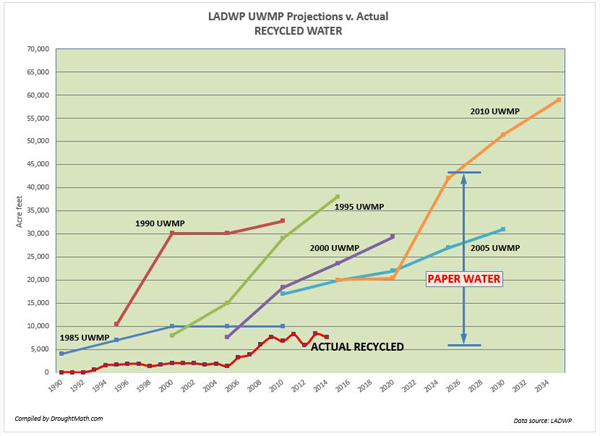
Our next stop where we find paper water in is the DWP’s Recycled Water projections. Urban Water Management Plans between 1990 and 2005 all projected rapidly growing recycled water supplies that later would never be realized.
The Recycled Water chart shows a huge gap indicating that up to 91% of water supply the city claimed it would have access to for future growth is just paper water.
In one example the DWP projected in the 1990 UWMP that the city would have 32,800 Af/y of recycled water by the year 2010. This number like all projections would be used as evidence of future growth by planners. But this water would never be realized. The actual average reported yield between 1995 and 2010 was just 2,921 Af/y which was 29,879 Af/y below what was promised. This 91% deficit is our paper water.
We find the same results in each of the other recycled water projections of plans that would follow. If we look at the 2010 projection in the 1995 UWMP, 84% of the 29,000 Af/y that was supposedly available ended up as paper water. In the 2000 plan, 75% of the 18,400 Af/y projected for the year 2010 ended up as paper. In the 2005 plan 65% of the 16,950 Af/y projected was paper water.
Over 24 years this would represent at least 384,096 AF of paper water that the city said it had access to as evidence that it had sufficient supply for projected growth but it never received that water.
Oddly, the DWP’s latest 2010 plan appears to be doubling down on paper water by citing that it will have 59,000 Af/y available to it by 2035. Already it looks like the first milestone in 2010 of 20,000 Af/y will be missed by a large margin which further demonstrates how that L.A’s drought and growth are built on paper water.
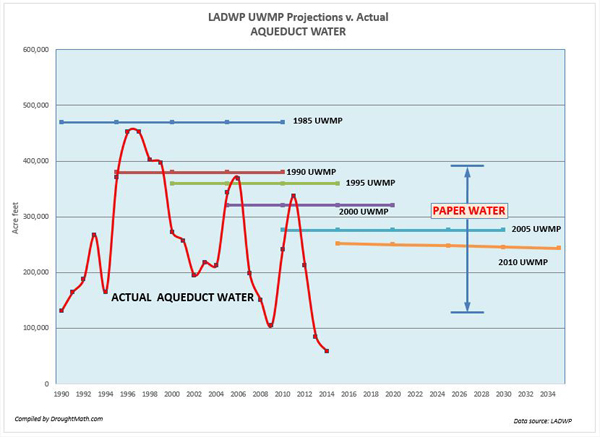
Paper Aqueduct Water
City never met its LA aqueduct projections
The city owned aqueducts have been our primary source of water since 1913 but in recent years it has also become the UWMP’s largest contributor of paper water.
Even though the aqueduct’s projections in each plan would fall incrementally due primarily to environmental mitigation, the percentage of paper water would increase from 38% during the 1990 UWMP reporting period to 54% by the 2005 UWMP reporting period.
In this example, if we look at the 1995 UWMP, aqueduct water was projected to be 360,000 Af/y which included surpluses for future growth. But that water never came down the pipe. The actual total reported supply was just 217,258 AF/y between 2000 and 2014 was 142,274 Af/y below what was promised. This meant that 43% of the projected total was paper water.
The 2000 UWMP projected aqueduct supplies to be 321,000 Af/y through to the year 2020. However to date the average supply has been just 210,132 Af/y meaning that 45% of the projected supply was paper water. The 2005 UWMP would look worse. It projected 276,000 Af/y through the year 2030 but the supply beginning with its reporting period has been just 173,393 Af/y meaning that over half of the water projected in this plan, 54% was paper water.
Over 24 years this would represent at least 1,863,000 AF of paper water that the city said it had access to as evidence of a growing supply but it never received to this date.
Paper MWD Water
Projects in L.A. promise that MWD will meet any city shortfalls in the future.
It’s hard to describe MWD water as paper water since most of the DWP’s projections for MWD water were greatly under reported from what was actually received. Typically when the City of L.A. fell short of water which was most of the time, the MWD would step in to fill in as much missing supply as it could. But water is a zero-sum resource and if you take more than your share of water, you’re taking it from another agency. There are limits to what the MWD could supply and history suggests that 423,000 Af/y was L.A’s limit.
MWD water can be described as paper water because each of the city’s UWMP assures that any shortfall of city owned water would be made up by MWD water which is a promise that can’t be met. That is promise made to planners more than it is to the city’s residents.
Paper Conservation
This category is a new form of paper water that was just introduced in the 2010 UWMP. In past years, the term conservation applied to water supply that was already received by the city and the value attributed to it was measured by the reduced number of gallons per capita. As mentioned at the beginning of this article, the DWP originally allocated about 175 gallons per capita in the 1985 and 1990 water plans which includes residential, commercial, government and industrial uses. The city’s conservation programs since then have reduced this to 141 gallons per capita using primarily Tier pricing and low-flow hardware devises. More recently it included so-called “turf buy back” and enforcement measures. In its simplest terms, ‘conservation’ is the ability to stretch out a given supply.
The DWP in 2010 decided to turn this idea on top of its head and count conservation as a source of supply that adds to the city’s total supply. This appears to be another attempt to produce more water on the ‘books’, but water that in time will not be accessible. The 2010 UWMP appears to be suggesting that the city will receive 14,180 Af/y of new water by 2015 and up to 64,368 Af/y by 2035.
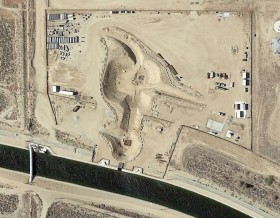
Paper Transfers
Neenach Pumping Station (Google Earth)
This is another new category to the UWMP. Transfers may also turn out to be another form of paper water since water transfers from other agencies is solely dependent on them having surplus water which is in doubt these days.
Most of the agencies the city could bargain with also depend on the SWP to supply them water. The SWP has been seriously cutting back allocations to their customers which includes the MWD.
The 2010 UWMP projects that it will receive 40,000 Af/y through the Neenach pumping station. Only time will tell if this is a viable and reliable source of water.
Summary
Overall the amount of water the city promised for future growth and did not meet is staggering. Each UWMP would follow a familar pattern. The first of the five year milestones would be adjusted relatively close to the current supply level and in the following 10, 15, and later milestone years, paper water would contribute to ‘unlikely to be reached’ levels of supply.
When we look at the 1990 UWMP for example we find that the total annual water supply projected by the year 2010 was 756,500 Af/y but the actual supply that came in during the scope of this plan was just 624,283 Af/y. Paper water represented 17% of total projection given the shortfall of 132,217 AF per year. The 2000 UWMP would raise the projections astronomically to 799,000 Af/y but as actual supplies came in, the average so far to date is just 617,645 Af/y thus producing a deficit of 181,355 Af/y per year.
Over 24 years, this would represent 4,352,000 AF of paper water that the city said it had access to as evidence of a growing supply but it never received to this date.
From the standpoint of development and the planning department, paper water is a good thing because the EIR’s, WSA’s and smaller projects that fall below SB-221 reporting requirements can all be assured that whatever their demand is, it will “fall within the available and projected water supplies” over the 20 to 25 year scope of the plan they are citing. Whether the city falls into a permanent drought is irrelevant to the approval process but it has huge repercussions elsewhere since the unmet demands means that the water must be found elsewhere when conservation isn't enough. These demands might be met by fallowing farmlands in the South San Joaquin valley or eliminating their supplies altogether forcing them to drive wells deeper to meet their shortfalls.
From the standpoint of residents however, paper water means higher utility bills, lower tier allocations, and lower property values for the unlucky homeowners who have high density built behind their yards but worst of all, it means the city's water supply is no longer reliable.
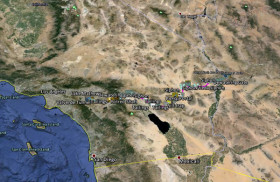
For those of you interested in seeing the Colorado River Aqueduct up close on Google Earth, download the Colorado River Aqueduct KML in the library on the right or click here to download it. To view it you must view it in GoogleEarth.
This a pared down version of my more complete KML but it still has a lot of fun stuff to explore.
The library now includes the LA Aqueduct, Hetch Hetchy, Sacramento Delta, and the State Water Project.
Note: KML's are just XML text files and can be opened up with a text editor like Notepad. Google Earth has an interpreter built into it which renders the paths and icons on global space.
Would "Lose the Lawn" solve the City of Los Angeles's water problem? Throughout the state the crescendo to eliminate residential lawns has grown louder among water boards, agencies and political leaders. In Los Angeles, a partnership between the Metropolitan Water District and the DWP will even pay residents $3.75 per square foot to convert their lawns 'drought tolerant' landscape with arguable curb appeal.
"Californians should water enough to save their trees, but should let their lawns go the way of all mortal things."
Felicia Marcus - Chairwoman Water Board
So given the following extreme example, how much water could the city save if every single family home throughout the city participated in the program and killed off their lawns? And what would the long term benefit be to residents?
According to the LADWP, the 627,395 single-family residential homes it serves used an average of 144.88 HFC (hundred cubic feet) of water during the 2013/2014 water year. The same year 764,402 multi-family residential homes used an average of 96.42 HFC.
In our example we'll ignore other patterns of usage between the two types of homes (residents per household, etc.) and simply assume that the difference is entirely landscape and cut the single family home demand to 96.42 HFC just like multi-family households.
By 'Losing the Lawn' we find the city would at most reduce water demand by 69,805 Af/y or 12%. The actual reduced demand would most likely be much lower.
Benefits are only temporary
Outside of finding a way through this statewide drought there is no real long term benefit from turf removal for the residents of the City of Los Angeles.
The main beneficiary of the reduced demand would be the Metropolitan Water District since the city would be buying less water from the agency each year. If the MWD could store this water and build up reserves that would be a good thing for all. However it will most likely will be a combination of storing some of the water and selling the rest to its other member agencies.
As for the city and it's residents, L.A.'s continued growth enabled by the departments heavy reliance on paper water would quickly wipe out all of the savings within ten years. The city's 2010 UWMP projects the demand will increase by 60,000 Af/y in 2025 and by 86,000 Af/y in 2030. Nearly all of this increase will be multi-family residential so effectively residents would be trading their homes lawn for density.
Since we can expect that the city's real water supply will remain flat, growth will assure that the city's future supply would be as tedious after the lawns are gone as they are today.
For those of you interested in seeing the Sacramento Delta up close on Google Earth, download the KMZ in the library on the right or click here to download it. To view it you must view it in GoogleEarth.
This a pared down version of my more complete KML but it still has a lot of fun stuff to explore.
The library now includes the LA Aqueduct, Hetch Hetchy, Colorado River Aqueduct and the State Water Project.
Where does the city's water go? This chart shows us how much water is used in each of the city's consumer classes between 1985 and 2014*. Since 2007 single-family residential demand has fallen from 261,530 Af to 208,678 Af. Multi-family residential has fallen from 187,059 to 169,192. More importantly, Residential per capita has fallen from 106 gallons per capita daily to 86.
*Supply shown in 'water years' (October thru September).
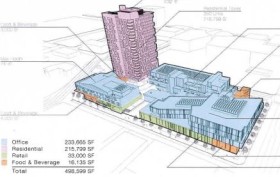 The two projects that apparently passed muster are the 250 unit Academy Square Project in Hollywood and the 1,444 unit South Los Angeles Village Project in downtown Los Angeles.

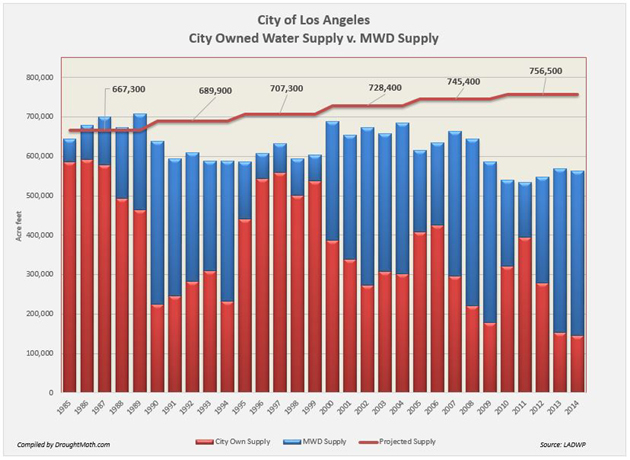
 Every UWMP from 1990 till now has projected supplies that exceeded 700,000 AF but when we look back at DWP records from 1990 to 2004 we find that the city’s total supply averaged just 627,000 Af/y. Since 2005 the average has fallen even further to just 590,000 Af/y. Simply put, the DWP has never met their projections and that has steered us head-on into a drought.
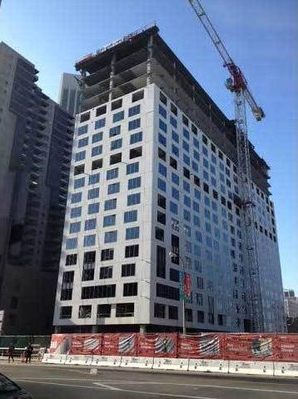

 For those of you interested in seeing the Colorado River Aqueduct up close on Google Earth, download the Colorado River Aqueduct KML in the library on the right or click
 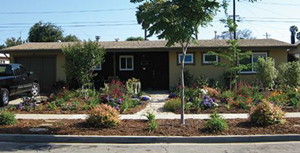 The main beneficiary of the reduced demand would be the Metropolitan Water District since the city would be buying less water from the agency each year. If the MWD could store this water and build up reserves that would be a good thing for all. However it will most likely will be a combination of storing some of the water and selling the rest to its other member agencies.
 *Supply shown in 'water years' (October thru September).